Fig. 2.
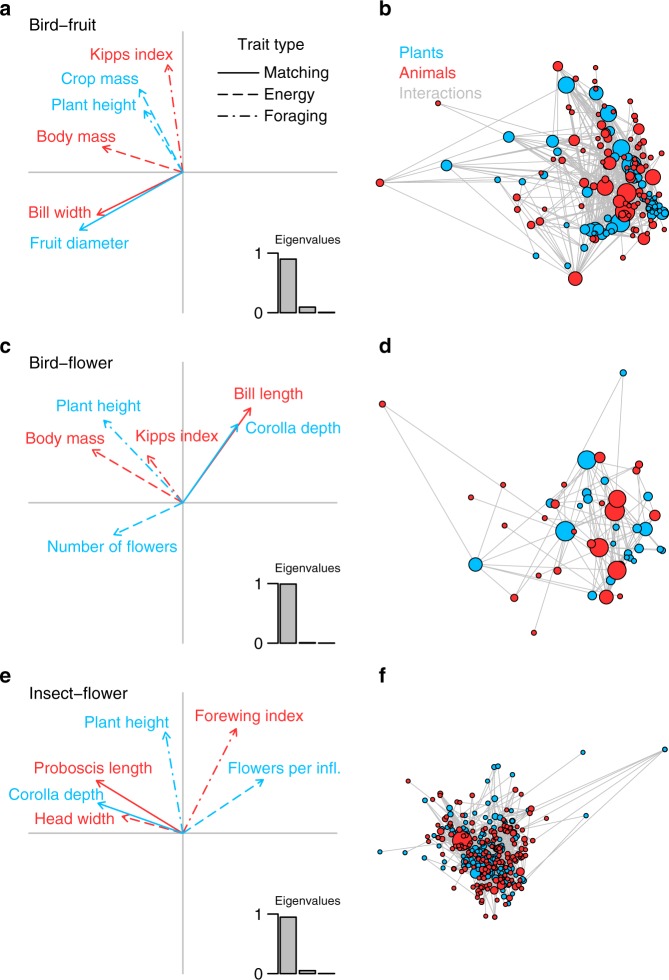
Associations of plant and animal functional traits in different types of plant–animal mutualistic networks. Results of a combination of RLQ and fourth-corner analyses for a, b bird–fruit, c, d bird–flower, and e, f insect–flower mutualisms. We use RLQ analysis (a, c, e) to map the multivariate trait space of animals on the multivariate trait space of plants based on plant–animal interaction networks. The eigenvalues of the RLQ analysis in a, c, e indicate the proportion of the cross-covariance between plant and animal trait spaces explained by each RLQ axis25. Vectors in a, c, e depict the coefficients of plant (blue) and animal (red) traits on the first two axes of the plant and animal trait spaces from RLQ analysis. If two vectors are long and point into the same or opposite directions the absolute correlation coefficient between the corresponding traits is large. Different line types in a, c, e indicate different types of functional traits, related to size matching (continuous line), energy provisioning of plants and energy requirements of animals (long-dashed line), as well as foraging stratum and mobility (dash-dotted line). b, d, f Representation of the mutualistic networks in the multivariate trait spaces of plants and animals. Dots in b, d, f represent species scores of plants (blue) and animals (red) in their multivariate trait spaces and grey lines depict interactions between plants and animals. The size of the dots is proportional to the number of links that a species has (i.e., species degree)

