Figure 7.
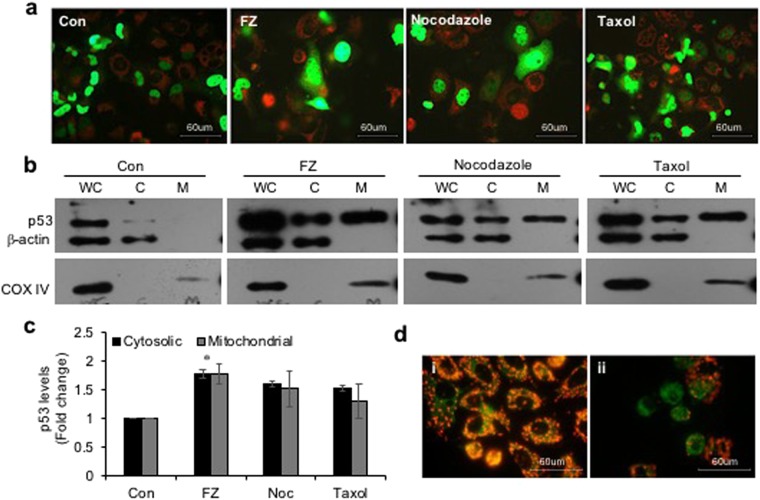
FZ treatment results in increased p53 translocation to mitochondria. (a) H1299 cells were transiently transfected with GFP-p53 expression construct and treated as before. They were then stained with red mitotracker dye (Molecular Probes) and fluorescent images were acquired using a Nikon fluorescence microscope. (b) H460 cells were treated with 1 uM FZ, 500 nM nocodazole or 100 nM taxol for 24 h. After treatment, mitochondria were isolated using a mitochondria isolation kit from Sigma. Whole cell lysates (WC), cytosolic (C) and mitochondrial (M) fractions were then resolved on SDS-PAGE and subjected to western blot analysis using anti p53, β-actin and COX IV antibodies. (c) The band intensities from “a” were quantified using Image J software and normalized with β-actin (WC and C) or COXIV (M) levels. (Full-length uncropped blots are included in Supplementary Fig. S6) (d) H460 cells were either left untreated or treated with 1 uM FZ for 24 h and then processed for JC-1 staining (i, control; ii, FZ).

