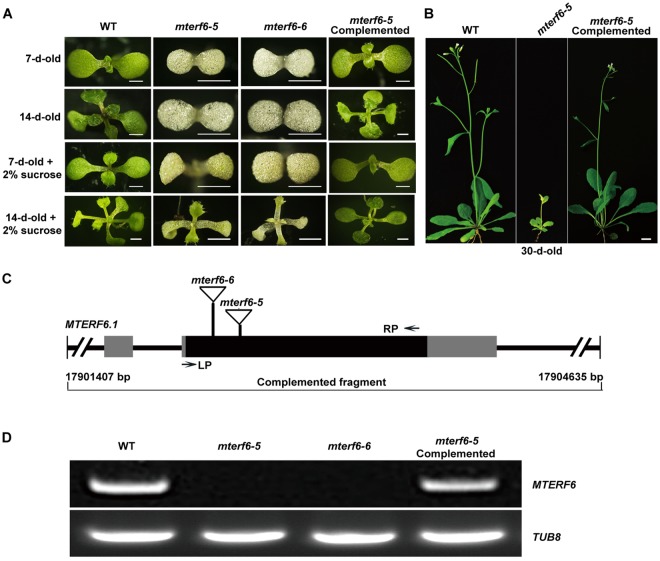
Figure 1.
Phenotype characterization and the T-DNA insertion sites identification of the mterf6 mutant. (A) Phenotype of the wild-type (WT; Columbia-0), mterf6-5 and mterf6-6 mutants, and mterf6-5 complemented plants grown on MS medium with or without 2% sucrose for 7 or 14 days. Bars = 0.1 cm. (B) Phenotype of the WT, mterf6-5 and mterf6-5 complemented plant grown in soil after being grown in MS medium with 2% sucrose for 2 weeks. Bar = 1 cm. (C) Positions of the two T-DNA insertions in the mterf6 mutants and the genomic fragment for complementation experiment. The black boxes, gray boxes and lines indicate the exons, untranslated regions and introns, respectively. The location of the primer pair (LP and RP) used for genotyping is shown by arrows. (D) MTERF6 expression in WT, mterf6-5 and mterf6-6 mutants and in the complementation line.

