
Figure 5.
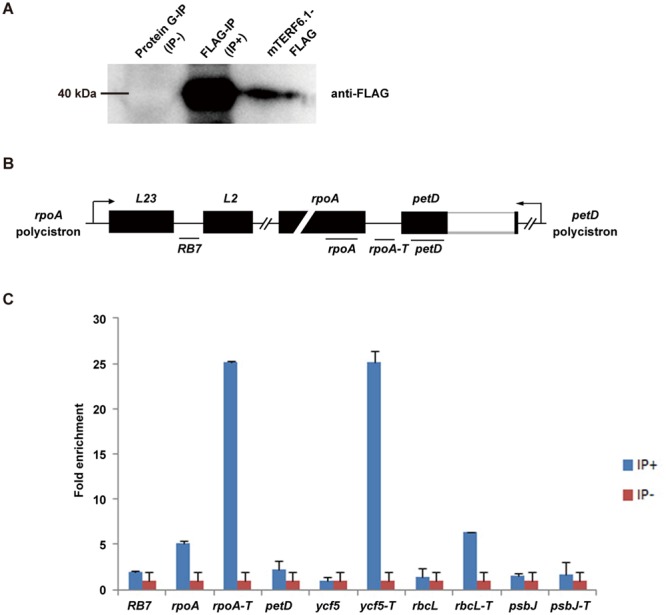
Chromatin immunoprecipitation quantitative PCR (ChIP-qPCR) analysis of the DNA binding activity of mTERF6 in vivo. (A) Immunoprecipitation and immunoblot analysis of mTERF6. The samples consisting of the total leaf protein extract from pMTERF6::MTERF6.1-FLAG transgenic plants (mterf6-5 background) were immunoprecipitated with the FLAG antibody-conjugated protein G beads (IP+) or naked protein G beads (IP−) as a control. The immunoblot analysis was performed with the FLAG antibody. The lane “mTERF6.1-FLAG” is the input. (B) The position of the designed primer pairs for ChIP-qPCR analysis. (C) DNA immunoprecipitation analysis. The chloroplasts fixed with formaldehyde (FA) were extracted from the pMTERF6::MTERF6.1-FLAG transgenic plants, then all of the DNA was sonicated into short fragments under specific conditions and incubated with the FLAG antibody-conjugated protein G beads. With the interaction between the FLAG antibody and the mTERF6.1-FLAG protein, the associated DNA was immunoprecipitated and analyzed by quantitative real-time RT-PCR. Error bars indicate standard deviations for triplicates.