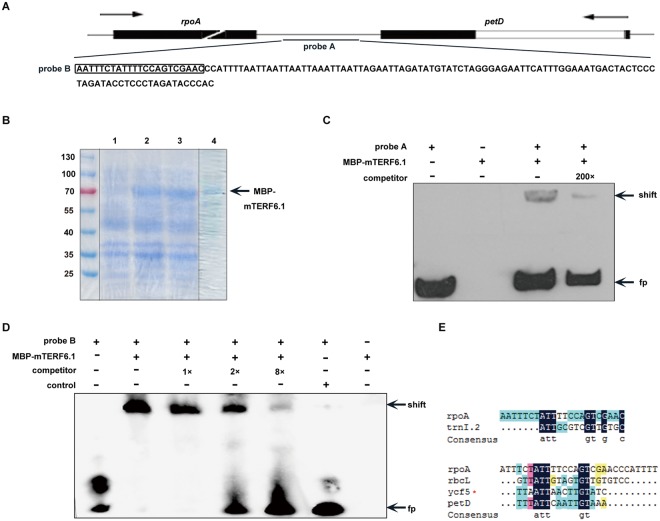
Figure 6.
Electrophoretic mobility shift assay (EMSA) by recombinant mTERF6. (A) Scheme of the probes used in the EMSA assay. Black boxes, white boxes and straight lines represent the exons, introns and interval regions, respectively. The locations and sequences of probes A and B were 5′-end labeled with biotin. Probe A is a double-stranded DNA fragment produced by PCR amplification and purification. Probe B is a single strand DNA. (B) Expression and purification of MBP-mTERF6.1 by SDS-PAGE analysis. Lanes 1 and 2 are the total proteins from the pre-induction cultures and post-induction cultures (induced by 0.4 mM IPTG at 18 °C for 6 h), respectively; lane 3 is the soluble extract induced (by 0.4 mM IPTG at 18 °C) overnight; lane 4 is the purified recombinant MBP-mTERF6.1 protein. The arrow indicates the expected band (This is a cropped gel. Full-length gels are included in Original pictures of Supplementary Fig. 6B). (C) The binding of MBP-mTERF6.1 to probe A. “fp” represents free probe. (D) The binding of MBP-mTERF6.1 to probe B. (E) Comparison of the exact binding sites of rpoA (3′-end) and trnI.2 and the 3′-end DNA sequences of other genes (rbcL, ycf5 and petD). Red “*” indicates that the analyzed DNA sequences of ycf5 are inside its downstream adjacent gene.

