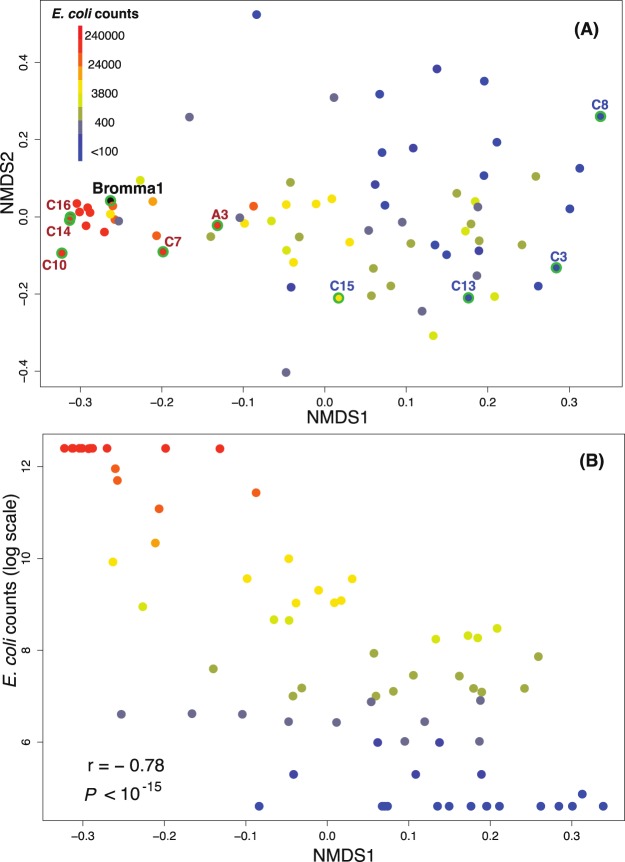
Figure 2.
Ordination of samples based on similarity in bacterial community composition and correlation with E. coli culturing counts. (A) Ordination of bacterial communities using NMDS based on Spearman rank order correlation coefficients. Samples are coloured according to their E. coli counts measured by culturing (Colilert-18®) except for the Bromma wastewater treatment plant sample that is coloured in black. Samples with green contours are the ten samples confirmed to be contaminated (red text) or not contaminated (blue text) by wastewater according to follow-up investigations. (B) Comparison between community composition (NMDS1) and E. coli density (E. coli culturing counts). Spearman rank order correlation coefficient (rho) and p-value are indicated.

