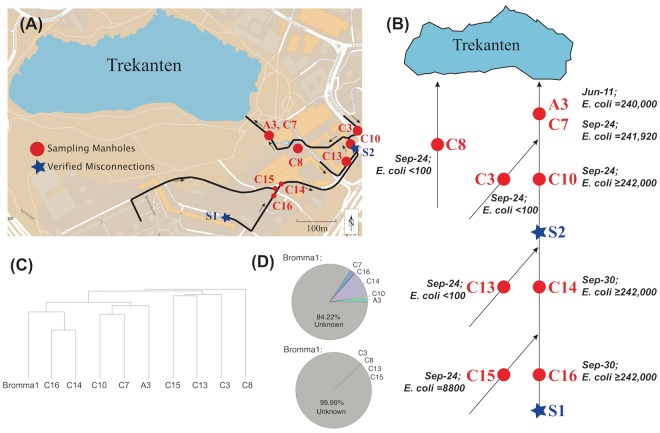
Figure 4.
The Lake Trekanten stormwater pipe systems. (A) Map showing the Lake Trekanten region. (B) Schematic view of the drainage flow in stormwater pipes in that region. Samples were taken from two adjacent but independent stormwater pipe systems near Lake Trekanten. The direction of flow is indicated by arrows. The red dots show the locations of the sampled manholes. The red and black texts indicate a sample’s name and its E. coli culturing counts, respectively. Samples A3 and C7 were taken from the same manhole on two different sampling occasions. The blue stars present the two locations, where misconnections were detected, with sanitary sewer pipes being connected to the stormwater pipes. Source 1 contained wastewater from toilets and bathrooms, while Source 2 consisted of wastewater from kitchens, toilets, and bathrooms. (C) Results from hierarchical clustering analysis based on Bray-Curtis similarities of sequence read abundances. Sample names and sampling dates are indicated. The maps used in (A) and (B) were created manually using Adobe Illustrator CC 201563 by modifying an image from Google Maps65. (D) Results of SourceTracker40 analysis, showing the contribution from the wastewater-contaminated (upper pie chart) and -uncontaminated (lower pie chart) stormwater samples to the bacterial community of the wastewater treatment plant sample.

