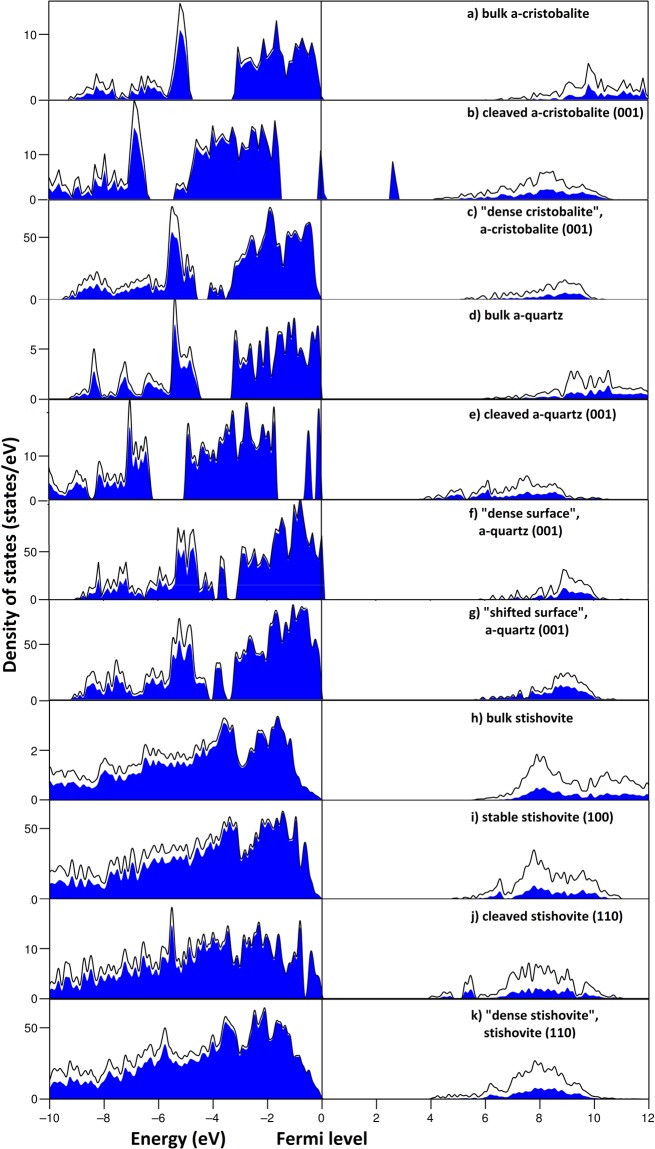
Figure 4.
DFT densities of states of α-cristobalite (001), α-quartz (001), stishovite (100) and (110), and bulk silica structures. Black lines represent total DOS, while O-p states, which make the main contribution to valence states, are highlighted by blue color. Cleaved surfaces of cristobalite and quartz possess O-p peaks at the Fermi level, while “dense surfaces” of all mentioned polymorphs have electronic structures close to corresponding bulk structures.

