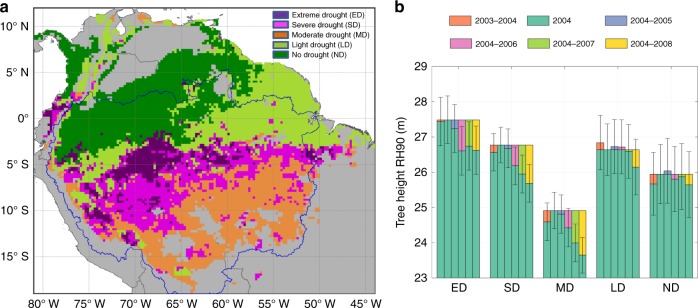
Fig. 1.
Spatial patterns of rainfall and corresponding canopy structure changes in each climatic region. a Drought classification map derived from rainfall data82. b Interannual changes of top canopy structure (RH90) relative to RH90 in 2004 for each climatic region defined in panel a. The abbreviations ED, SD, MD, LD, and ND are regions of extreme drought, severe drought, moderate drought, light drought, and no drought. The purple line in panel a delineates the boundary of Amazon basin area. Non-tropical forests in panel a were colored in gray. The error bars in panel b stand for 95% confidence intervals. Estimations in panel b were derived from the spatial modeling with filled data gaps (SMF) method (see Methods)

