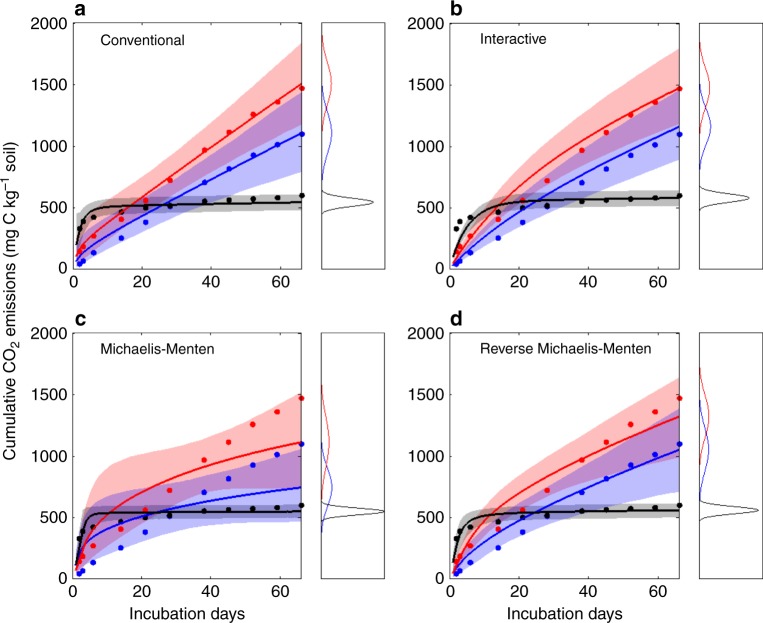
Fig. 3.
An example showing the performances of different models in simulating cumulative CO2 emissions from old and new C substrates. Dots and lines are observations and model simulations, respectively. Shading areas are the simulated ranges from 2.5th to 97.5th percentiles (i.e., 95% range). Blue and red, CO2 emissions from old C at the control and new C addition treatments, respectively; Black, CO2 emissions from added new C. The distributions of model-simulated cumulative CO2 emissions at the end of experiment are also shown in each panel

