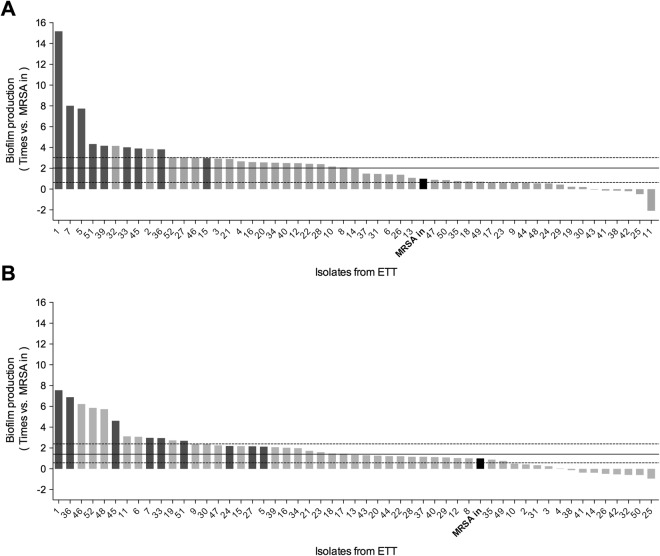
Figure 1.
Biofilm production of 52 ETT-MRSA isolates compared with the MRSA-in under ambient air or ambient air with 5% CO2. Each bar represents the biofilm production of each ETT-MRSA isolate versus the MRSA-in (black bar). (A) Biofilm production O2 on day 2 after extubation (peak production); 50% of ETT-MRSA isolates increased biofilm production more than double that of MRSA-in. (B) Biofilm production under 5% CO2 on day 1 after extubation (peak production); 40% of ETT-MRSA isolates increased more than twice MRSA-in biofilm production. The highest biofilm producers ETT-MRSA isolates (n = 9), in dark gray, under both O2 and 5% CO2 were selected to undergo the biofilm production dynamics post-extubation. Abbreviations: 5% CO2, ambient air with 5% CO2; O2, ambient air; ETT-MRSA, clinical MRSA isolates from endotracheal tubes; MRSA-in, MRSA inoculated into pigs’ lungs; MRSA, methicillin-resistant Staphylococcus aureus.

