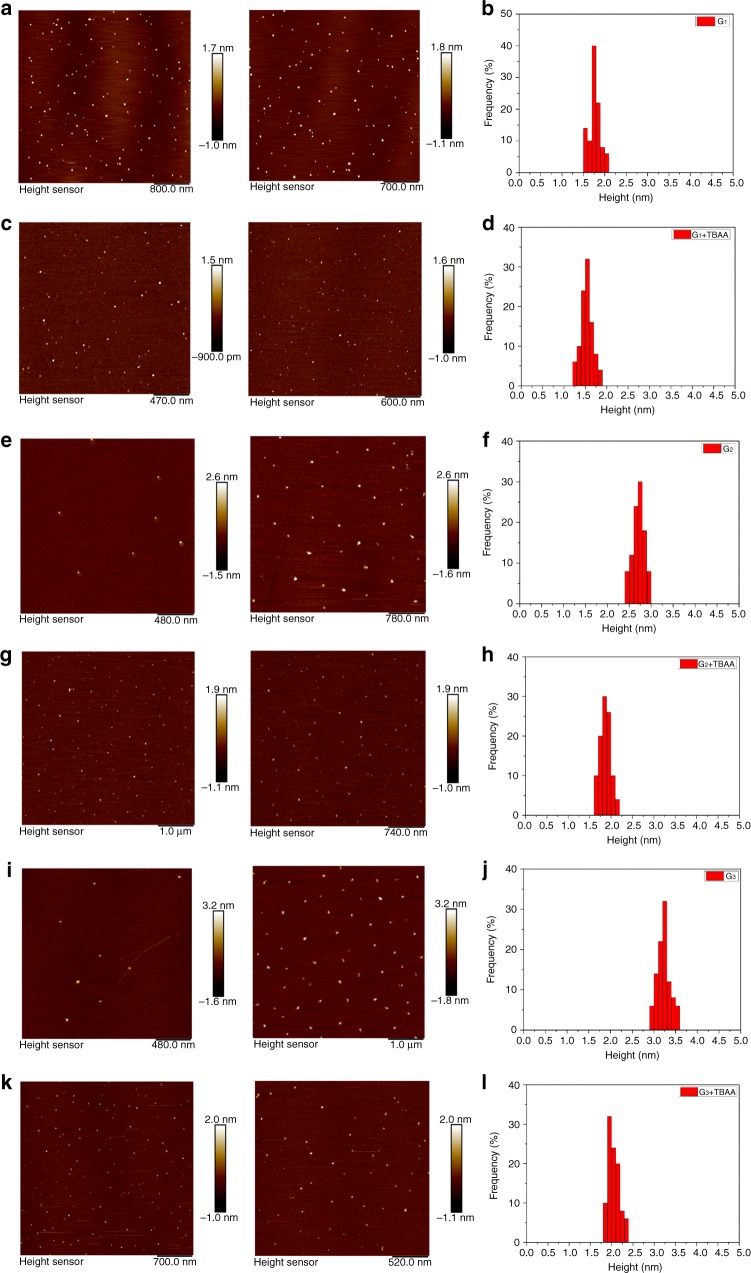
Fig. 7.
AFM images of rotaxane-branched dendrimers. a G1; c G1 with the addition of TBAA; e G2; g G2 with the addition of TBAA; i G3; k G3 with the addition of TBAA; and height distributions of the rotaxane-branched dendrimers b G1, the height range is 1.76 ± 0.26 nm; d G1 with the addition of TBAA and the height range is 1.52 ± 0.29 nm; f G2, the height range is 2.70 ± 0.29 nm; h G2 with the addition of TBAA and the height range is 1.85 ± 0.25 nm; j G3, the height range is 3.21 ± 0.34 nm; l G3 with the addition of TBAA and the height range is 2.05 ± 0.30 nm

