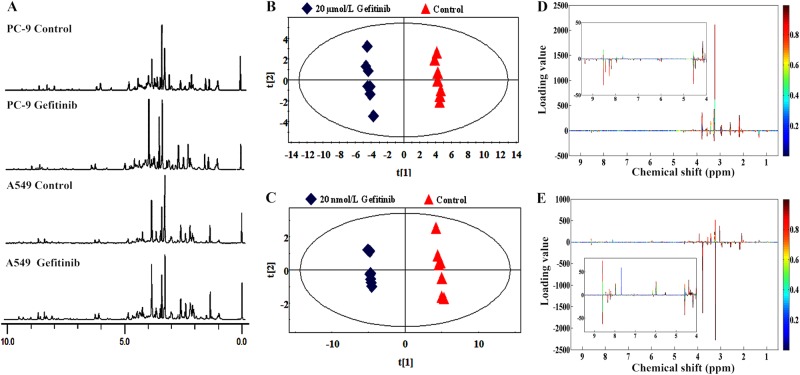
Fig. 1. Gefitinib treatment induces differences in the metabolic profiles of PC-9 and A549 cells.
a Representative 1H-NMR spectra (δ0.0–δ10.0) of PC-9 and A549 cells after a 24-h incubation with or without 20 µM and 20 nM gefitinib, respectively. b, c PCA score plots of PC1 versus PC2. The untreated A549 cells (b) and PC-9 cells (c) are shown as red triangles, and gefitinib-treated samples are shown as blue diamonds. Each group contains seven replicates. d, e The color map separately shows the significant variations in the chemical shifts of A549 cells (d) and PC-9 cells (e). Peaks in the positive direction represent enhanced chemical shifts in the gefitinib-treated group compared to the corresponding untreated group. Decreased chemical shifts in the gefitinib-treated group are presented as peaks in the negative direction

