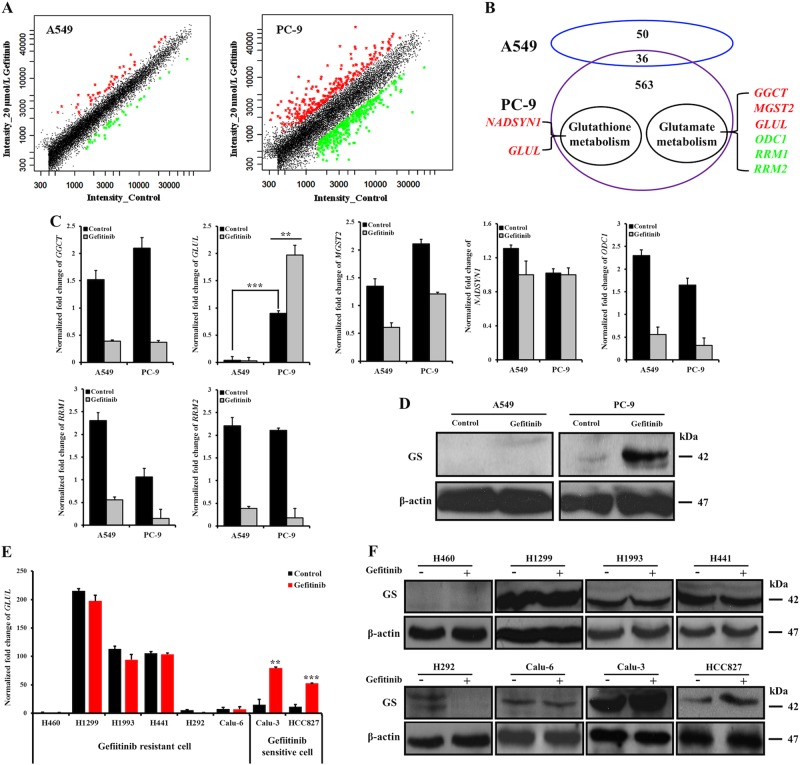
Fig. 4. GLUL and GS levels were upregulated in gefitinib-sensitive cells in response to the gefitinib treatment. Gefitinib-resistant cells lack GLUL expression or exhibit no significant changes following the gefitinib treatment.
a After separately exposing A549 and PC-9 cells to 20 µM and 20 nM gefitinib, respectively, for 48 h, DNA microarray scatter plots were prepared to reveal the expression of activation-induced genes in gefitinib-treated cells compared with that in the corresponding control cells. Each point represents a gene; the red points indicate genes that significantly upregulated in gefitinib-treated cells (ratio ≥ 2-fold, p < 0.05), whereas the green points indicate genes that were significantly downregulated (ratio ≤ 0.5-fold, p < 0.05) in response to the gefitinib treatment. The black points represent genes for which the signal intensity ratio was between 0.5 and 2, indicating that gefitinib treatment had no obvious effect on these genes. b A scheme displays the relationships between the differentially expressed genes in A549 and PC-9 cells. The genes related to glutamine metabolism are listed. The red- and green-colored genes represent increased and decreased gene expression, respectively, in gefitinib-treated cells. c Changes in the mRNA expression levels of seven important genes (GGCT, GLUL, MGST2, NADSYN1, ODC1, RRM1, and RRM2) in A549 and PC-9 cells in response to the 48-h gefitinib treatment are shown. The data represent the mean ± SEM of three independent experiments. *p < 0.05; **p < 0.01; ***p < 0.001, two-tailed Student’s t-test. d Western blot detection of the levels of the GS protein in A549 and PC-9 cells after treatment with 20 µM and 20 nM gefitinib, respectively, for 48 h. e, f Changes in GLUL mRNA expression levels were quantified by qRT-PCR (e), and the GS protein levels were examined by western blotting (f) in cells treated with gefitinib for 48 h and the corresponding control cells. The bars shown are normalized to the GAPDH control and represent the mean ± SD of triplicate samples

