Figure 1.
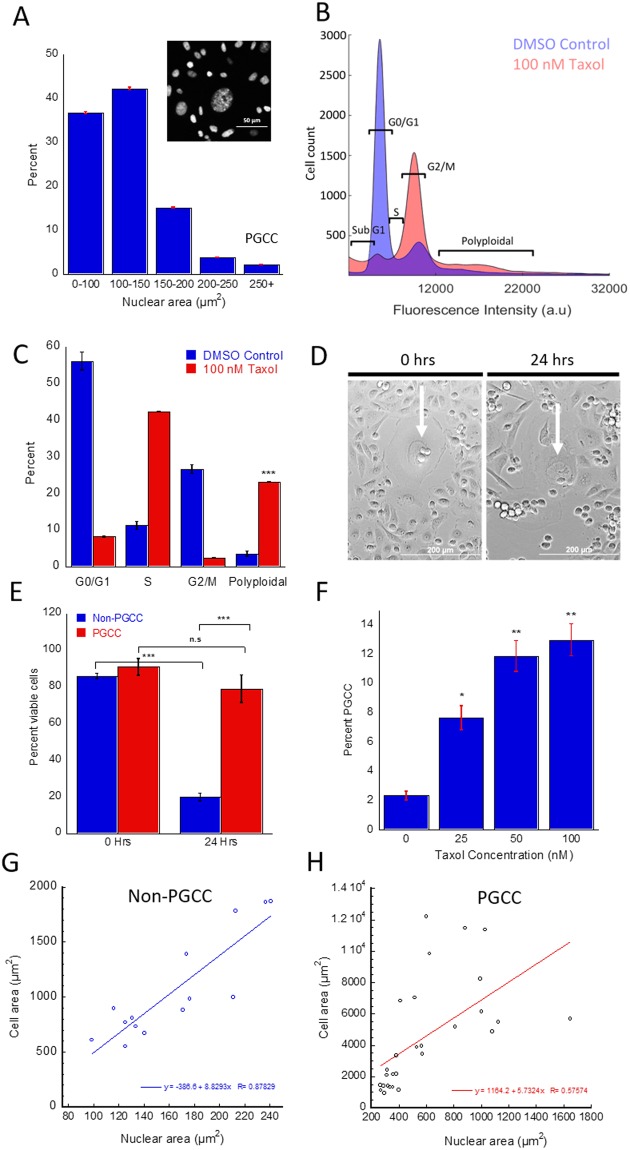
Characterizing PGCC occurrence and PTX resistance in MDA-MB-231 cancer cells. (A) Nuclear area distribution of MDA-MB-231 cells stained with DAPI (n = 5, 5000 + cells). (B) Cell cycle analysis via flow cytometry of DMSO and 48-hr 100 nM PTX treated cells show different stages of cell cycle and polyploidy. (C) Quantification of cell cycle analysis for DMSO and 100 nM PTX treated cells reveal increased PGCC occurrence. (D) Time lapse images of MDA cells before and after 24-hr treatment with 100 nM PTX (PGCCs indicated by white arrow). (E) Quantification of time lapse cell survival (500 + cells) show PGCC resistance to treatment. (F) PGCC incidence rate rises with increasing doses of 48-hr PTX treatment (n = 4). (G) Nuclear and cell area correlation of non-PGCCs and (H) PGCCs (40 + cells) show decreased correlation in the PGCC subpopulation. Cell cycle analysis and time lapse experiments were performed in triplicate. Results are reported as the mean ± SEM. Significance is indicated as *p < 0.05, **p < 0.01, ***p < 0.001.

