FIGURE 5.
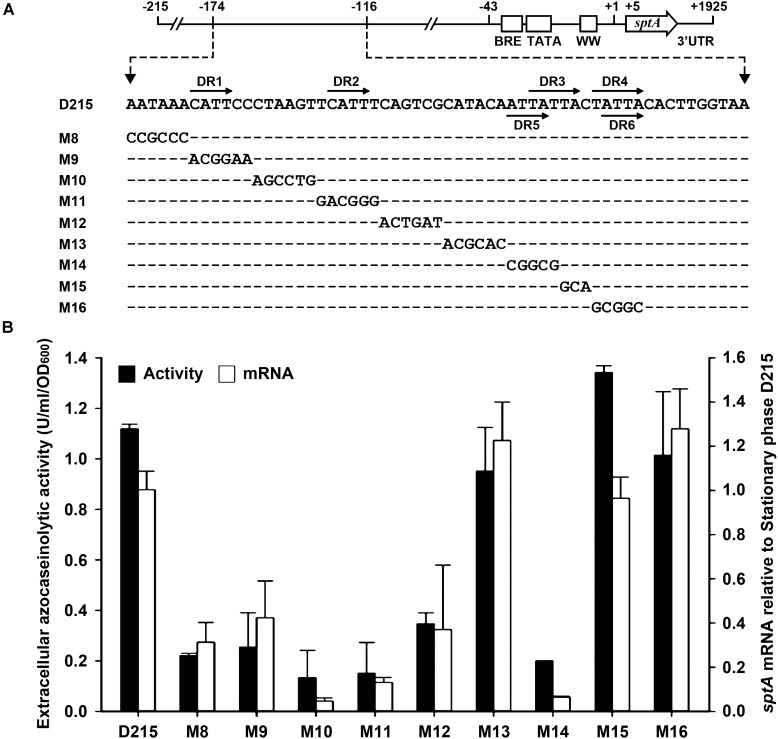
Site-directed mutational analysis of the enhancer region of sptA. (A) Sequences of the enhancer regions (–174 to –124) of the construct D215 and its mutants. The direct repeat sequences (DR1/DR2, DR3/DR4, and DR5/DR6) are indicated by horizontal arrows. In the sequences of the mutants (M8 to M16), the mutated and unaltered nucleotides are shown in letters and dashes, respectively. (B) Promoter activity assay. The ΔsptA2 mutants harboring the recombinant plasmids were grown in 23% MGM with 5 μg ml-1 mevinolin at 37°C. The stationary phase culture supernatants were subjected to azocaseinolytic activity assay. The levels of sptA transcripts in stationary phase cells were determined by qRT-PCR analysis using 16S rRNA as an internal control, and the transcript levels of the mutants were determined relative to that of the construct D215. Values are expressed as the means and standard deviations (error bars) of three independent experiments.

