Figure 9.
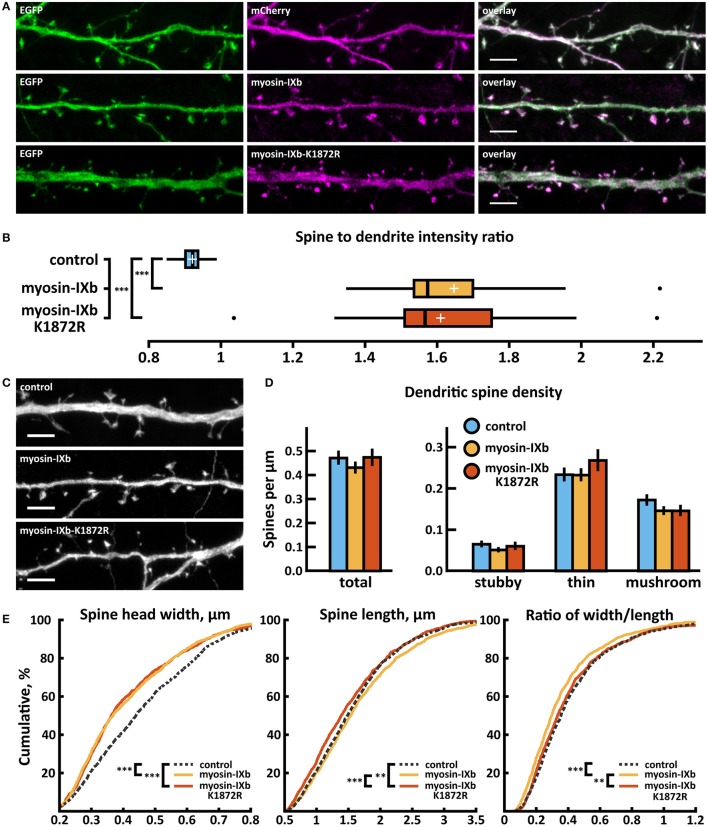
Characterization of protein localization, dendritic spine density and morphology in DIV14-15 hippocampal neurons expressing EGFP and mCherry (control), wild-type myosin-IXb-mCherry or mutated myosin-IXb-K1872R-mCherry. (A) Representative maximum projections of confocal Z-stacks for EGFP, mCherry, and wild-type and mutated myosin IXb localization. Scale bars, 4 μm. (B) The quantification of protein localization revealed revealed similar enrichment for both wt and mutated myosin-IXb to dendritic spines. Spine-to-dendrite fluorescence intensity ratios: control: 0.92 (n = 21 cells, 210 spines), myosin-IXb: 1.65 (n = 18 cells, 180 spines), myosin-IXb-K1872R: 1.61 (n = 14 cells, 140 spines). Center lines show the medians; box limits indicate the 25th and 75th percentiles as determined by R software; whiskers extend 1.5 times the interquartile range from the 25th and 75th percentiles, outliers are represented by dots; crosses represent sample means. ***p < 0.001 as determined by one-way ANOVA test with Games-Howell post-hoc test. (C) Maximum projections of confocal Z-stacks of dendrites from neurons overexpressing EGFP along with either mCherry, myosin-IXb-mCherry or myosin-IXb-K1872R-mCherry. Only EGFP channel is shown and was used to assess spine density and morphology. Scale bar, 4 μm. (D) Quantification of dendritic spine density calculated as number of spines per 1 μm of dendrite. The first left cluster of bars represents total spine density. Densities of thin, mushroom, stubby, and total spines were as follows: wt: thin = 0.24, mushroom = 0.18, stubby = 0.07, total = 0.48 spines/μm (n = 21 neurons, 1,567 spines, 3,321 μm dendrite); myosin-IXb: thin = 0.24, mushroom = 0.15, stubby = 0.06, total = 0.44 spines/μm (n = 18 neurons, 1,059 spines, 2,475 μm dendrite); myosin-IXb-K1872R: thin = 0.27, mushroom = 0.15, stubby = 0.06, total = 0.49 spines/μm (n = 14 neurons, 1,006 spines, 2,120 μm dendrite). Data is pooled from 3 experiments and represented as mean ±SEM. Significant differences were not detected by one-way ANOVA test with Bonferroni post-hoc test. (E) Cumulative distributions of the width, length, and the ratio of width to length of dendritic spines for neurons expressing either mCherry (control), myosin-IXb-mCherry or myosin-IXb-K1872R-mCherry. Curves are a combination of data points each representing an individual spine. Matching tail regions of the curves are not shown. **p < 0.01, ***p < 0.001 as determined by pairwise two-sample Kolmogorov-Smirnov test.

