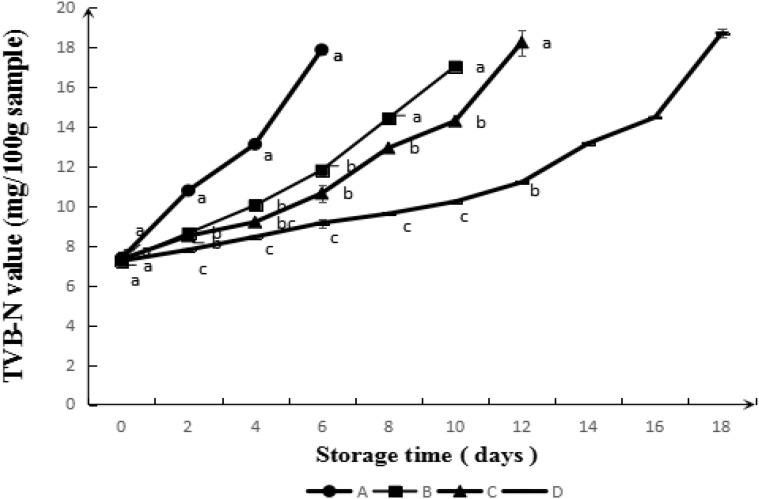
FIGURE 6.
Evolution of TVB-N value during simulated retail display (4°C) of pork untreated (A) and treated with CS (B), GA-CS (C), and GA-g-CS (D), respectively. Data are presented as means ± SD of triplicates. Different letters at the same sampling time denote significant differences (p < 0.05) between treatments.

