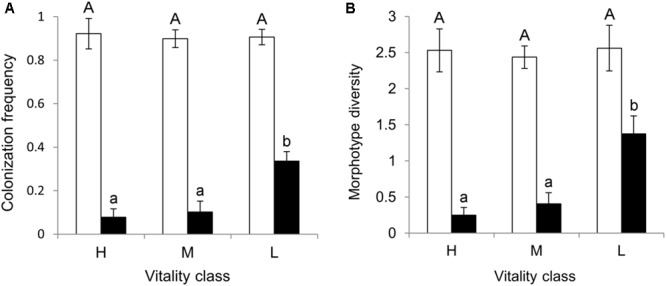
FIGURE 2.

(A) Colonization frequency (CF = proportion of bark and xylem samples with at least one emerging colony) and (B) morphotype diversity (SMT = number of different MTs recovered per twig) mean values in bark (white bars) and xylem (black bars) of pedunculate oak twigs (n = 32) collected from trees (n = 8) in three vitality classes (H, high; M, medium; L, low). Shown are the mean values of eight replicate trees (±SE) with different letters indicating significant difference among vitality classes (Kruskal Wallis test, p < 0.05 in xylem tissues for both CF and SMT).
