FIGURE 3.

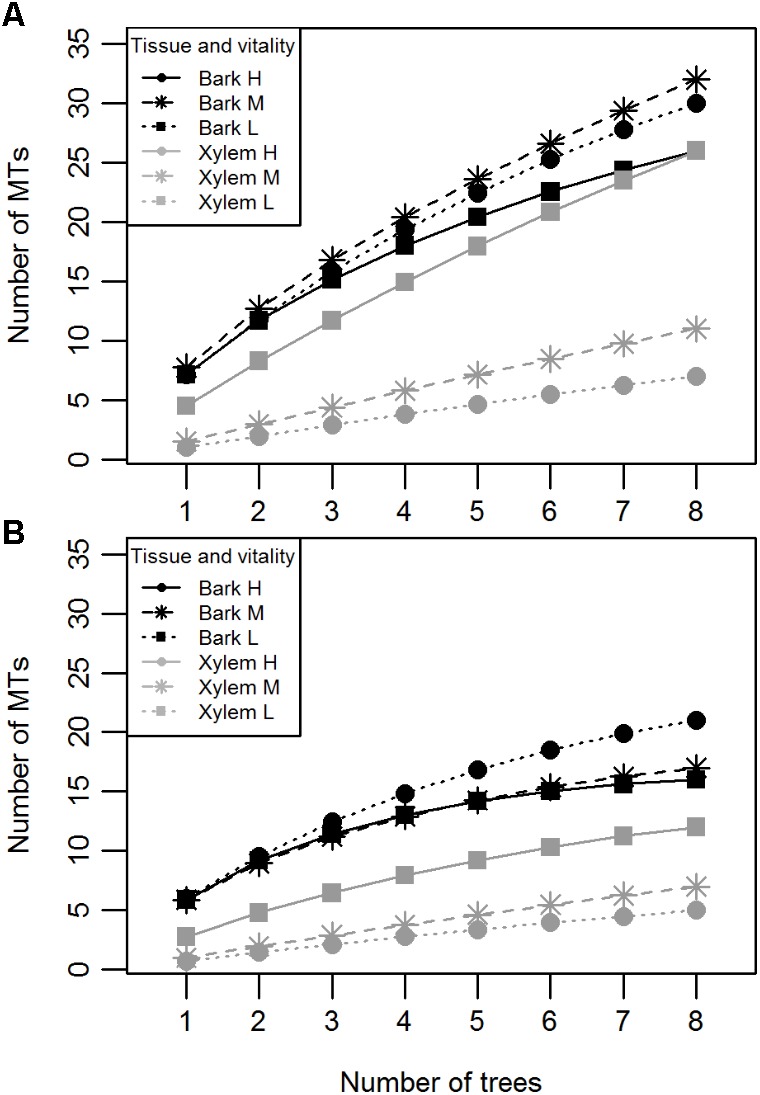
Individual-based rarefaction curves of pedunculate oak endophytes indicating the number of MTs isolated per tissue (bark or xylem) and vitality class (H, high; M, medium; L, low) with (A) and without (B) singletons.

Individual-based rarefaction curves of pedunculate oak endophytes indicating the number of MTs isolated per tissue (bark or xylem) and vitality class (H, high; M, medium; L, low) with (A) and without (B) singletons.