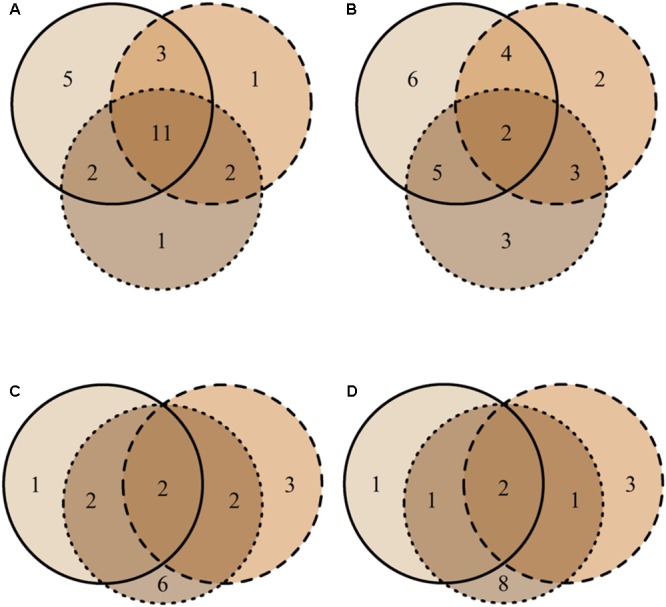
FIGURE 5.

Venn diagrams representing the distribution of unique MTs found in high vitality class (solid line), medium class (dashed line), low vitality class (dotted line), and MTs shared among the three vitality classes (overlapping areas) based on their presence-absence (A) and similar abundance (B) in bark and the presence-absence (C) and similar abundance (D) in xylem. The numbers indicate how many morphotypes were found in each vitality class and shared among vitality classes. MT30 is not included since it represents the group of singletons.
