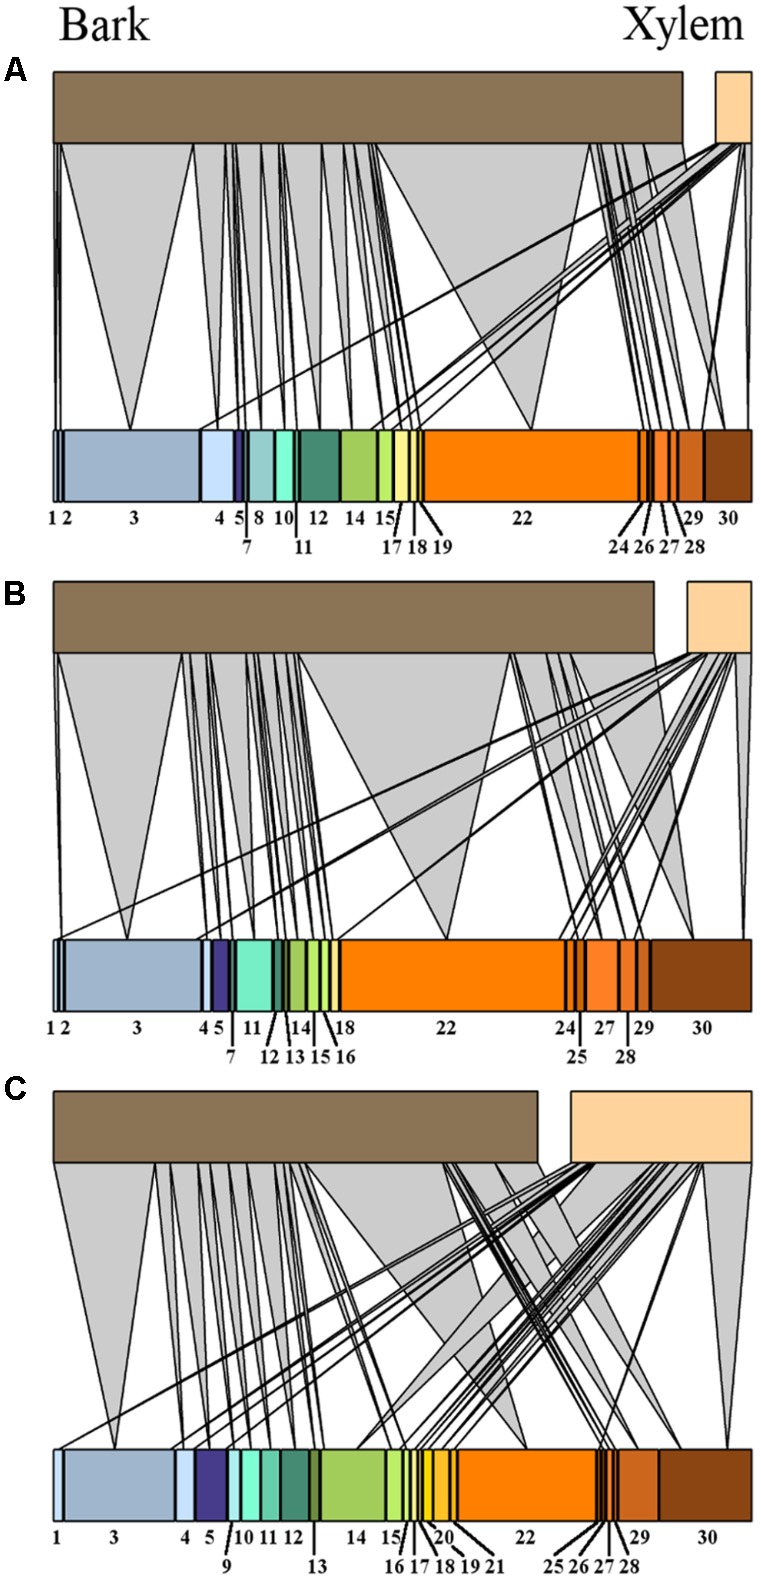
FIGURE 6.

Bipartite network graphs representing the isolates relative abundance of fungal isolates, arranged after morphotype (indicated by number) in oak tissues (xylem and bark) from high (A), medium (B), and low (C) tree vitality classes.

Bipartite network graphs representing the isolates relative abundance of fungal isolates, arranged after morphotype (indicated by number) in oak tissues (xylem and bark) from high (A), medium (B), and low (C) tree vitality classes.