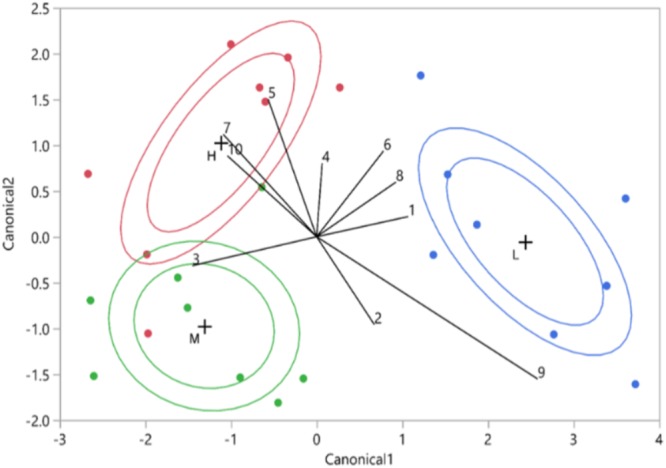
FIGURE 7.

Vitality class based on canonical discriminant analysis of HPLC data (10 UV-absorbing peaks. The red points represent the high vitality leaves (H), the green points the medium vitality leaves (M), and the blue points the low vitality leaves (L). The internal ellipsoid line represents the normal ellipse region estimated to contain the 50% of the population of the group. The external ellipsoid line represents the confidence region containing the true mean of the group with 95% accuracy. The numbers represent the phenolics from the 10 biggest phenolic peaks.
