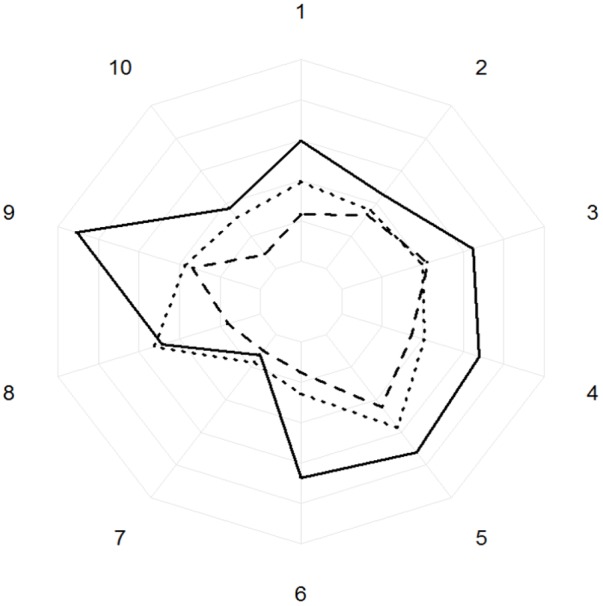
FIGURE 8.

Areas under the curve of the peaks of absorbance (AU/mg) of the ten biggest phenolics peaks for high (dotted line), medium (dashed line), and low (solid line) vitality classes. The concentric circles represent the areas under the curve with an increasing of 10,000 AU/mg at every concentric circle. The numbers represent the phenolics from the 10 biggest phenolic peaks.
