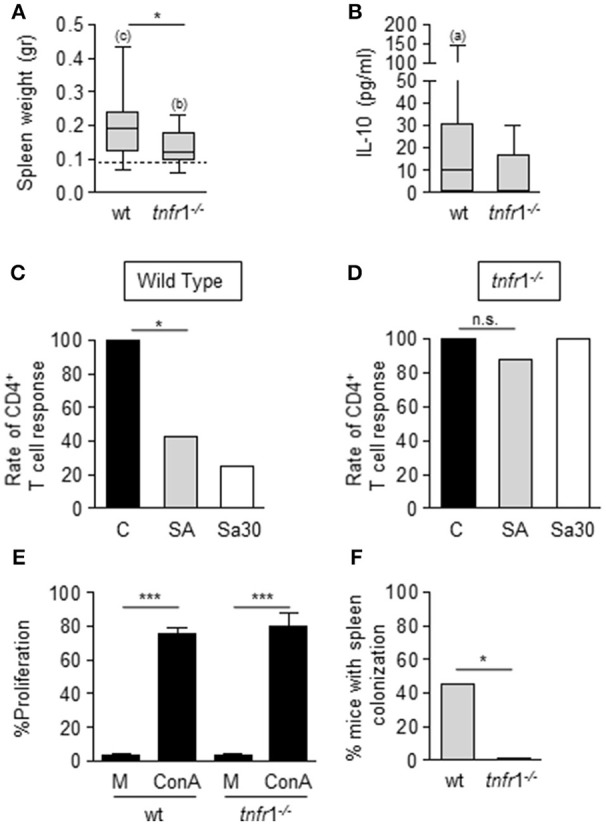
Figure 2.

Impact of TNFR1 signaling on the local and systemic host response during S. aureus sepsis of peritoneal origin. (A–F) Groups of C57BL/6 wild type and tnfr1−/− mice were inoculated with S. aureus FPR3757 (SA, gray bars and boxes), S. aureus Sa30 (Sa30, white bars) or PBS (C, black bars) by intraperitoneal route. (A,B) Spleen weight (A) and plasma levels of IL-10 (B) were determined at day 8 post-inoculation. IL-10 was not detected in plasma from mice inoculated with PBS. Boxes and whiskers depict maximum and minimum values obtained from individual mice and the horizontal line represents the median for each group. Dotted line in (A) depicts median value of the PBS group (wild type and tnfr1−/− combined) *p < 0.05, (a) p < 0.05, (b) p < 0.01, (c) p < 0.001, (a, b, c) compared with the corresponding groups inoculated with PBS, Mann-Whitney U-test for nonparametric data. (C,D) Bars represent the percentage of mice with CD4+ T cells that responded to ConA stimulation (less than 10% decrease in the proliferative capacity compared with the control group). *p < 0.05, Fisher's exact test. (E) Splenocytes from mice inoculated with PBS were stimulated with medium or ConA (5 μg/ml). Bars represent the proliferative capacity of CD4+ T cells in response to medium or ConA stimulation. ***p < 0.001, Unpaired t-test. (F) Bars represent the percentage of mice with spleen colonization at day 8 post-inoculation. *p < 0.05, Fisher's exact test.
