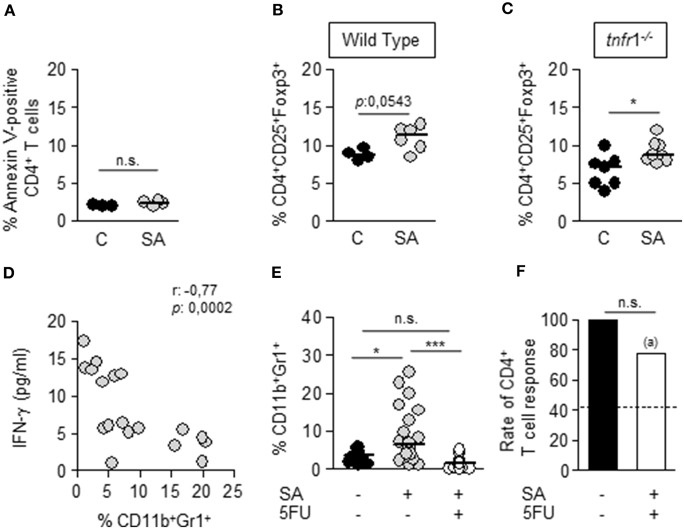
Figure 3.
Mechanisms involved in T cell dysfunction during S. aureus sepsis. Groups of C57BL/6 wild type (A,B, D–F) and tnfr1−/− (C) mice were inoculated with S. aureus FPR3757 (SA, gray circles) or PBS (C, black circles and bars) by intraperitoneal route and treated or not with 5FU (50 mg/Kg) (white bar) at day 4 post-inoculation by the same route. (A–C) The percentage of Annexin V-positive CD4+ T cells (A) and the percentage of Treg cells (CD4+CD25+Foxp3+) (B,C) present in the spleen at day 8 post-inoculation were quantified. Each circle represents an individual mouse and the horizontal lines indicate the median value for each group. *p < 0.05, Mann-Whitney U-test for nonparametric data. (D) Correlation analysis between the levels of IFN-γ produced by splenocytes of S. aureus inoculated mice in response to ConA and the percentage of CD11b+Gr1+ cells present in the spleen of each mice at the time of splenocyte isolation. Each circle represent an individual mouse. Data were analyzed using the Spearman test. (E) Percentage of MDSC present in the spleen at day 8 post-inoculation. *p < 0.05, ***p < 0.001, Mann-Whitney U-test for nonparametric data. (F) Bars represent the percentage of mice whose CD4+ T cells were able to respond to ConA stimulation (less than 10% decrease in the proliferative capacity compared with the control group). Dotted line indicates the rate of CD4+ T cell response in mice inoculated with SA and not treated with 5FU. (a) p < 0.05, compared with S. aureus inoculated mice not treated with 5FU; n.s. not significant, Fisher's exact test.

