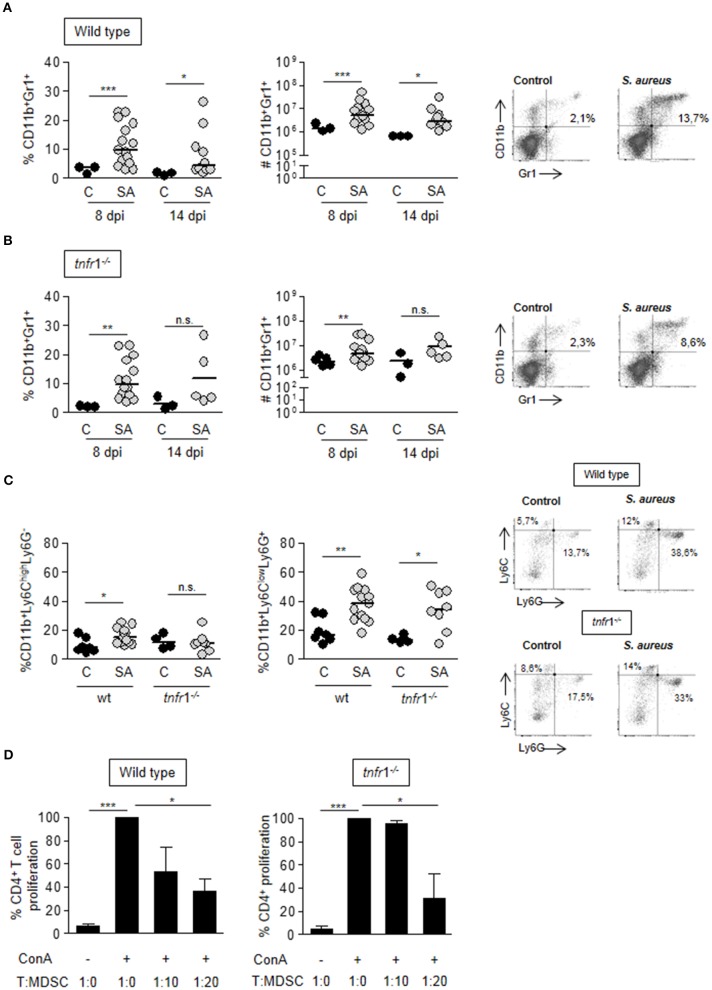
Figure 4.
MDSC expansion and accumulation in the spleen during S. aureus sepsis. (A–D) Groups of C57BL/6 wild type (A,C) and tnfr1−/− (B,C) mice were inoculated with S. aureus FPR3757 (SA, gray circles) or PBS (C, black circles) by intraperitoneal route. (A,B) The percentage and the absolute number of CD11b+Gr1+ cells present in the spleen was determined at days 8 and 14 post-inoculation by staining with specific antibodies and flow cytometry analysis. Representative dot plots and percentages of cells gated as CD11b+Gr1+ at day 8 post-inoculation are shown. (C) CD11b, Ly6G, and Ly6C expression was determined in splenocytes at day 8 post-inoculation. Results were calculated after gating on the CD11b+ population. Representative dot plots of Ly6G and Ly6C-stained cells and the quantitation of Mo-MDSC: Ly6ChighLy6G− and PMN-MDSC: Ly6ClowLy6G+ are shown. *p < 0.05, **p < 0.01, ***p < 0.001, Mann-Whitney U-test for nonparametric data. The quadrants were placed according to the isotype controls. (D) Splenocytes from naive mice were co-cultured with different proportions of CD11b+Gr1+ cells purified from S. aureus inoculated mice at day 8 post-challenge and stimulated with ConA (5 μg/ml). Bars represent proliferation of CD4+ T cells relative to that observed in the absence of MDSC (considered as 100%). *p < 0.05, ***p < 0.001, Unpaired t-test.

