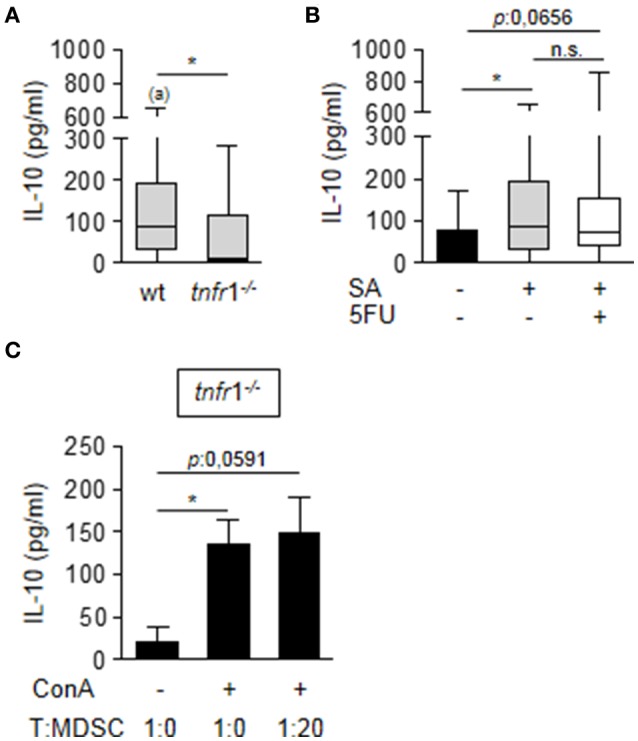
Figure 7.

Impact of TNFR1 expression in the production of IL-10. (A,B) Groups of C57BL/6 wild type (A,B) and tnfr1−/− (A) mice were inoculated with S. aureus FPR3757 (SA, gray boxes and bars) by intraperitoneal route and treated or not with 5FU (50 mg/Kg) (white box) at day 4 post-inoculation. IL-10 production in the spleen was quantified by ELISA. Boxes and whiskers depict maximum and minimum values obtained from individual mice and the horizontal line represents the median for each group. *p < 0.05, (a) p < 0.05 (compared with wild type mice inoculated with PBS) Mann-Whitney U-test for nonparametric data. (C) Splenocytes from naïve tnfr1−/− mice were co-cultured with different proportions of CD11b+Gr1+ cells purified from tnfr1−/− mice inoculated with S. aureus and stimulated with ConA (5 μg/ml). Bars represent IL-10 levels in the supernatant at 72 h post-stimulation. *p < 0.05, Mann-Whitney U-test for nonparametric data.
