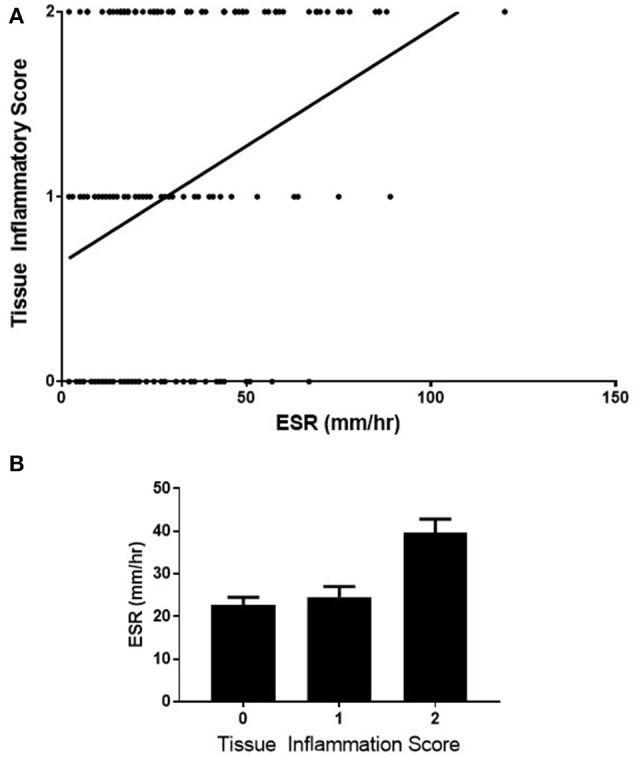
Figure 3.

Correlation of ESR with tissue inflammation scores (A) correlation of ESR with tissue inflammation score on H+E staining. n = 188, rho = 0.29, Cl 0.15–0.42 p < 0.0001. (B) comparison of the ESR across the 3-point tissue inflammation score using Kruskaii-Wallis test, p = 0.0001.
