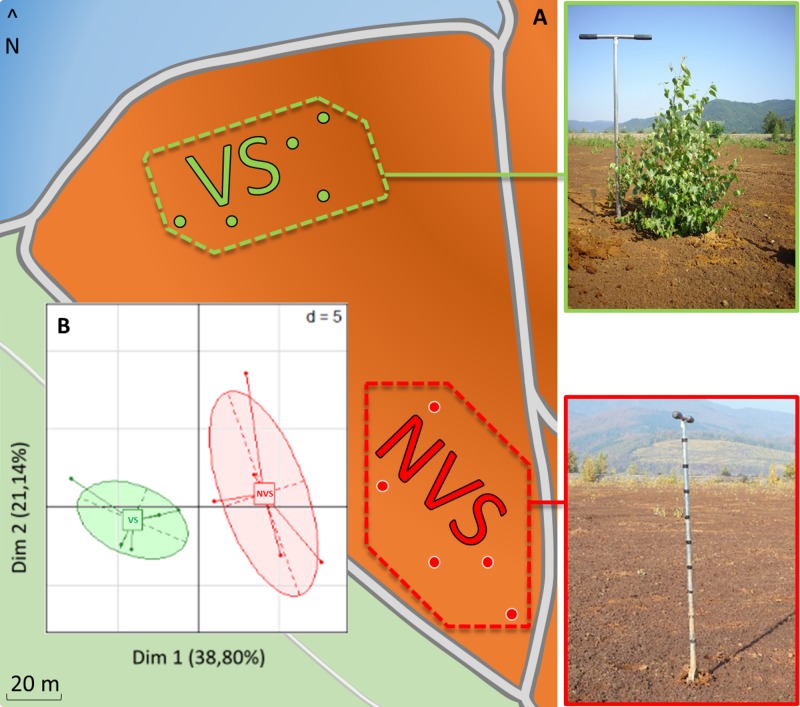
FIGURE 1.
(A) Diagram of the sampling site with soils taken in a vegetated area under birch trees (VS, top-left photo, green dotted line) or soil taken in a non-vegetated area (NVS, bottom-left photo). (B) PCA carried out with soil data and soil element concentrations discriminating between the two sampling areas, n = 5.

