FIGURE 1.
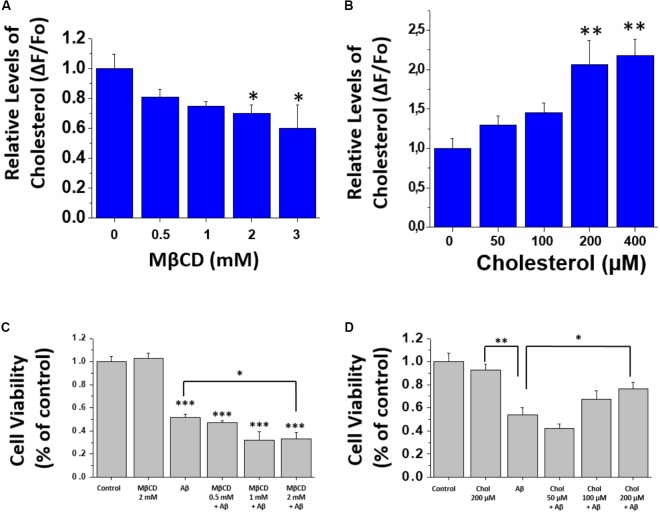
Modification of cholesterol levels in hippocampal neurons. (A,B) Quantification of filipin III fluorescence showing relative levels of cholesterol after treatment with MβCD (0.5–3 mM), and after treatment with different concentrations of soluble cholesterol (0–400 μM) in hippocampal neurons. (C,D) Cell viability assay performed after treatments to modify membrane-cholesterol and subsequent Aβ incubation (1 μM for 24 h). The bars represent the mean ± SEM. Asterisks denote: ∗p < 0.05, ∗∗p < 0.005, ∗∗∗p < 0.001.

