FIGURE 2.
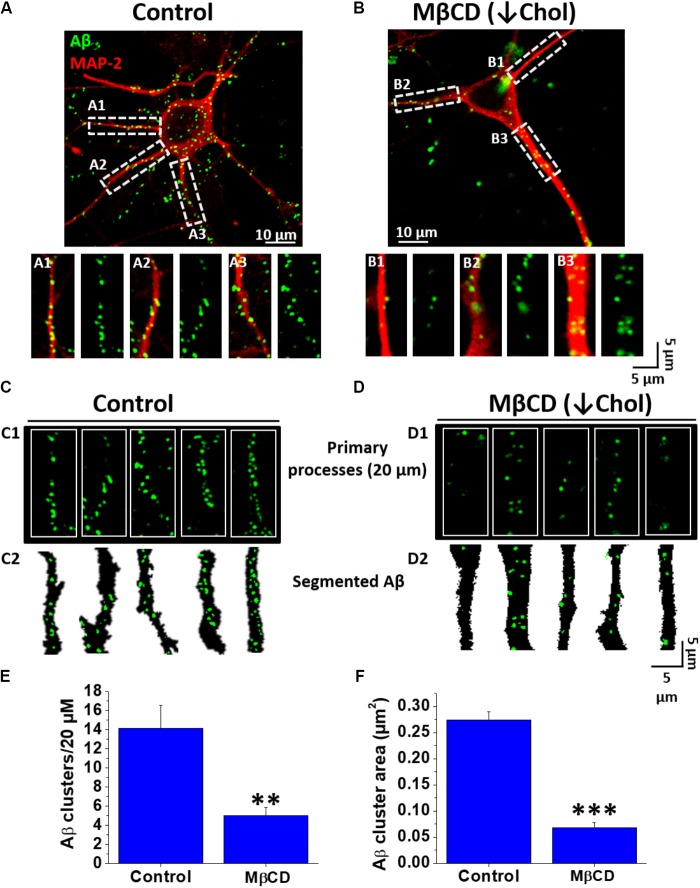
Decreased Aβ association to neurons after lowering cholesterol. (A,B) Confocal microscopy images of hippocampal neurons exhibiting fluorescence for MAP-2 (red) and demonstrating the distribution of Aβ42-FAM (green) aggregates on the cell membrane in control and after treatment with MβCD (3 mM) for 30 min. (A1–A3,B1–B3) ROIs of representative neurites showing the overall distribution of Aβ (1 μM, after 1 h treatment) on neuronal processes. (C,D) Representative traces of primary processes shown in (A,B), respectively. (E,F) Quantification of Aβ clusters (number and area) in the first 20 μm of hippocampal neuron primary processes showing that both parameters decreased after treatment with MβCD (3 mM) for 30 min. The bars represent the mean ± SEM. Asterisks denote: ∗∗p < 0.005 and ∗∗∗p < 0.001.

