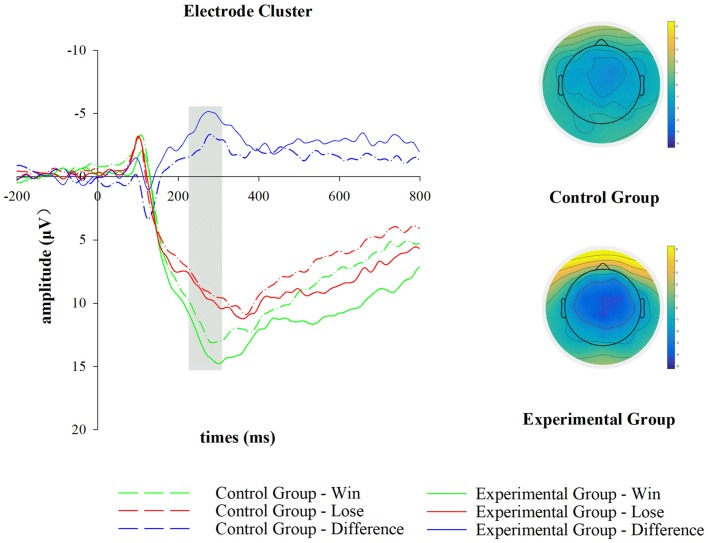
Figure 2.
Feedback-related negativity (FRN) results during the outcome appraisal stage. For illustration, grand-averaged event-related potential (ERP) waveforms of FRN and FRN loss-win difference wave (d-FRN) from the electrode cluster (FC1, FCz, FC2) are shown for group (control group versus experimental group) and outcome (win versus lose) conditions. The scalp topographic distribution of d-FRN is provided for control and experimental groups, and the bar for the topographic map ranges from −5 μV to 5 μV.

