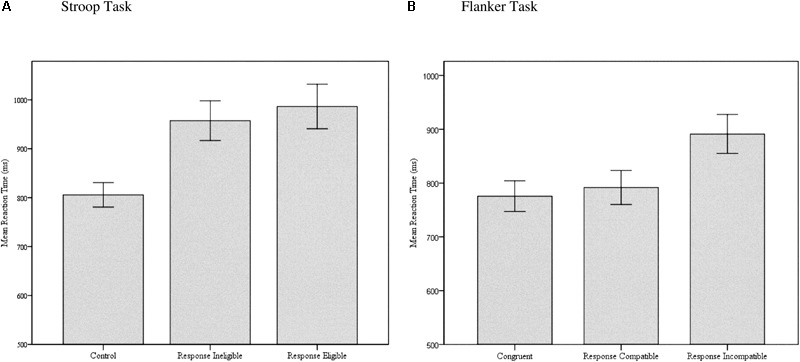
FIGURE 5.

Bar graphs of mean reaction times on the (A) Stroop and (B) Flanker task for the different task conditions, demonstrating the relative contribution of SS-conflict and SR-conflict to the overall interference effect. Error bars represent 95% confidence intervals.
