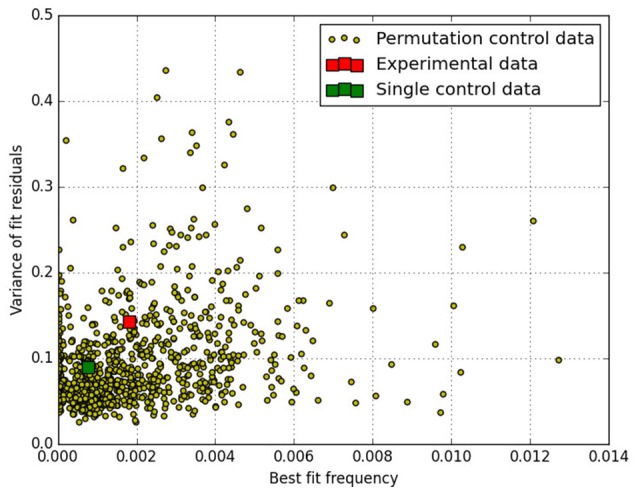
Figure 1.

Scatter plot of 1,000 sets of permutated data that each have been fitted with the (decaying) oscillation to determine the best fit frequency (ω). The main experimental result as presented in Maier et al. (2018) lies at ω = 0.0018 with 386 results of the simulated data having larger ω-values than that. The majority of fits has better goodness-of-fit (smaller variance of the fit residuals) than the experimental data as reported in Maier et al. (2018). The (unpermuted) experimental data is shown as the red square and the single control data set of Maier et al. (2018) is shown as a green square.
