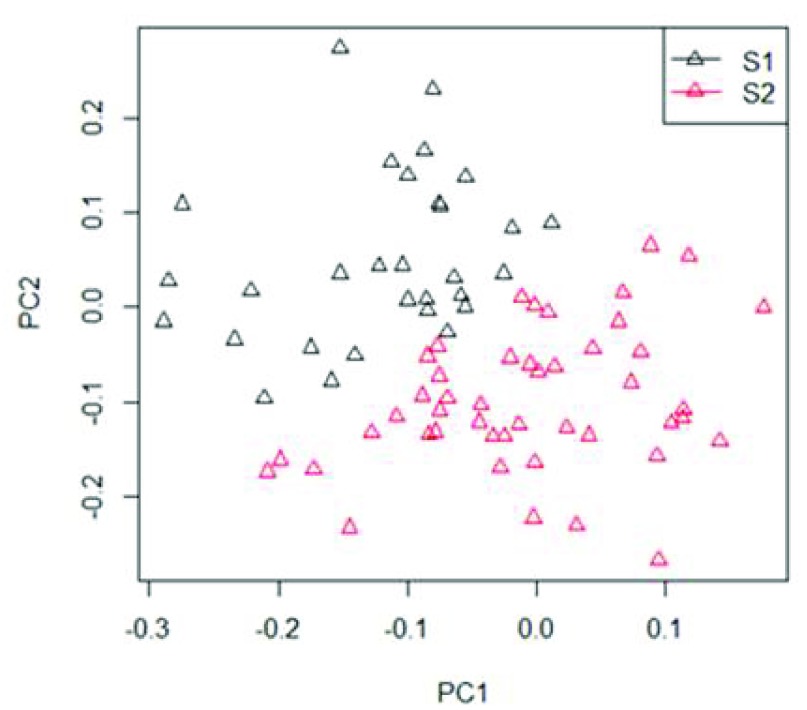
Figure 2. Principal component analysis of continuously measured systolic arterial pressure (SAP) from 76 women in supine position into two groups S1 (black) and S2 (red).
There is one point per woman, with coordinates given with respect to the first and second principal component. PC= principal component.

