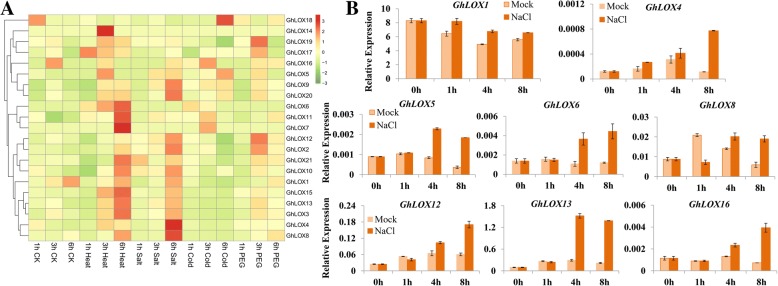
Fig. 5.
Expression profile of GhLOX genes in response to different abiotic stresses. a Abiotic stress related transcriptomic data were obtained from NCBI and its normalization and visualization was performed using the pheatmap package. b The relative expression of selected GhLOX genes under 200 mM salt stress was determined by qRT-PCR. The cotton UBQ7 gene was used as internal control. Error bars denotes the standard deviation calculated from three independent experiments

