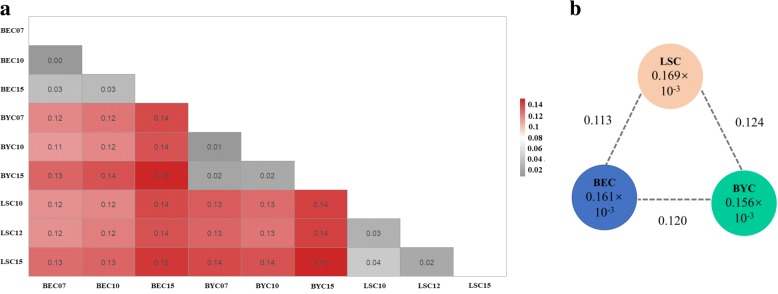
Fig. 4.
a Matrix showing pairwise differentiation estimates (FST) between nine breed sub-populations. b Nucleotide diversity (π) and genetic differentiation (FST) across the three breeds. The value in each circle represents a measure of nucleotide diversity for this breed, and the value on each line indicates genetic differentiation between the two breeds

