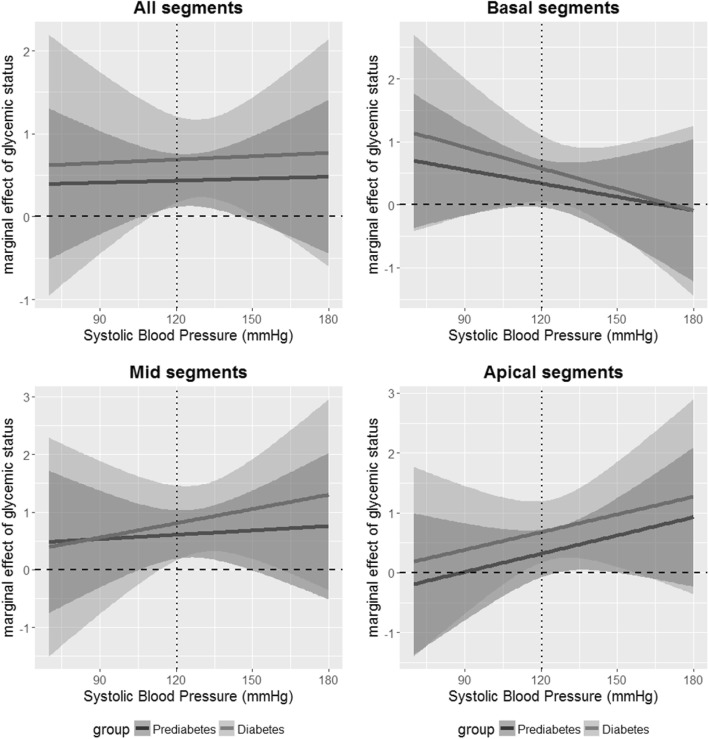
Fig. 2.
Marginal effects of glycemic status on wall thickness for multiplicative interactions with systolic blood pressure. Marginal effects indicate the size of the association of the respective group (prediabetes or diabetes) with wall thickness for a specific value of systolic blood pressure. Displayed are the marginal effects of prediabetes (solid line, dark grey) and diabetes (solid line, light grey) and the respective 95% confidence interval for a grid of possible values of systolic blood pressure (range in data: 73–179.5 mmHg). The arithmetic mean is indicated by a dotted line. The dashed line indicates the line of no effect

