. 2014 Sep 1;6(1):705–713. doi: 10.1039/c4sc02181a

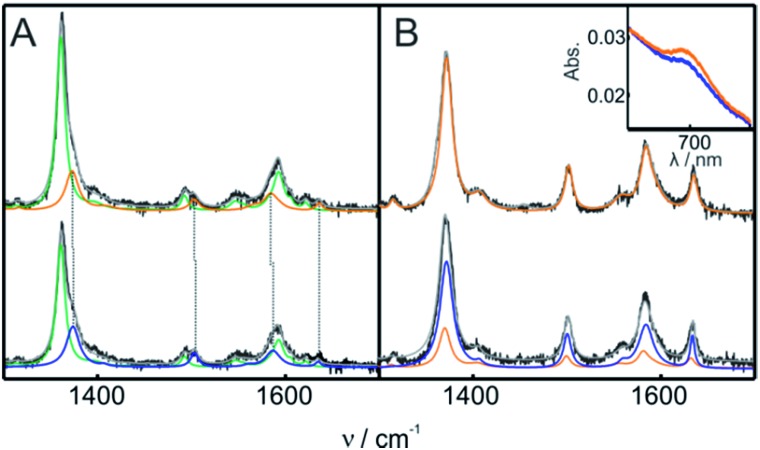
Fig. 3. (A) SERR spectra of Cyt-c adsorbed on an Ag electrode coated with NH2-SAMs recorded before (top) and after (bottom) the addition of 1 mM H2O2 (final concentration). The spectra were acquired while cycling the electrode potential between 0.1 V and –0.3 V at 0.05 V s–1 in 10 mM phosphate buffer, pH = 7. The colors indicate the different spectral components. Green: ferrous native Cyt-c. Orange: ferric native Cyt-c. Blue: OH/His ferric component. (B) RR spectra of 0.2 mM ferric Cyt-c in 10 mM phosphate buffer, pH = 7, containing 0.5 mM PC/PE liposomes. The spectra were recorded before (top) and after (bottom) the addition of 1 mM H2O2 (final concentration). The color code of the RR spectral components is the same as that for the SERR spectra in panel (A). The inset shows the UV-vis charge transfer band before (orange) and after (blue) the addition of H2O2.

Fig. 3