. 2014 Sep 1;6(1):705–713. doi: 10.1039/c4sc02181a

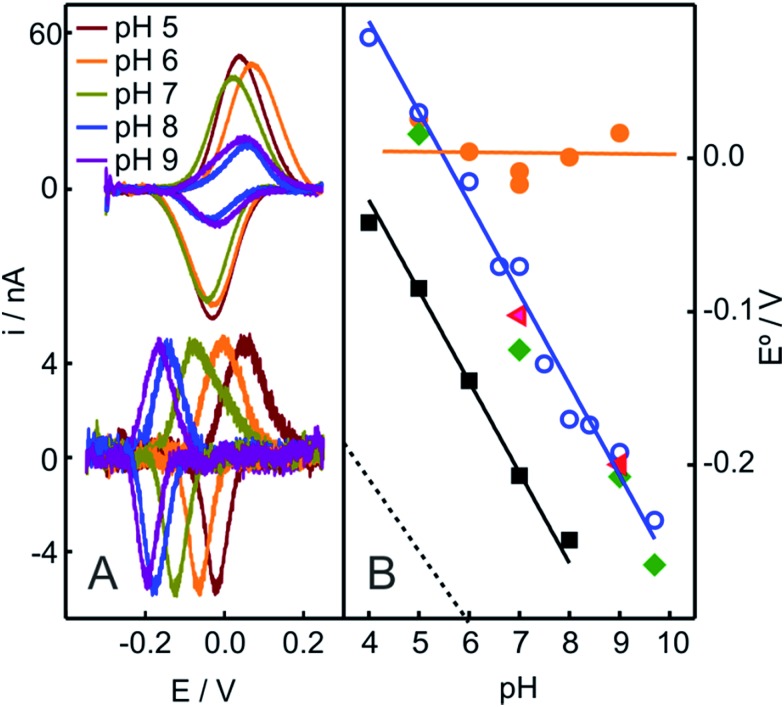
Fig. 4. (A) Voltammetric signals of Cyt-c adsorbed on NH2-SAMs recorded at different pH values before (top) and after (bottom) the addition of 2 mM H2O2 (final concentration). (B) pH-dependencies of the reduction potentials of different protein species adsorbed on NH2-SAM electrodes. Orange circles: native Cyt-c. Blue circles: Cyt-c adsorbed on the same electrode after in situ pretreatment with 1 mM H2O2. Green diamonds: Cyt-c pretreated ex situ with 1 mM H2O2 in the presence of 5 mM PE liposomes. Red triangles: ex situ synthesized and purified SO-Cyt. Additionally, the black squares correspond to the M80A Cyt-c mutant cross-linked to a COO-SAM (this work) and the dotted line corresponds to horseradish peroxidase on glassy carbon electrodes, adopted from ref. 56.

Fig. 4