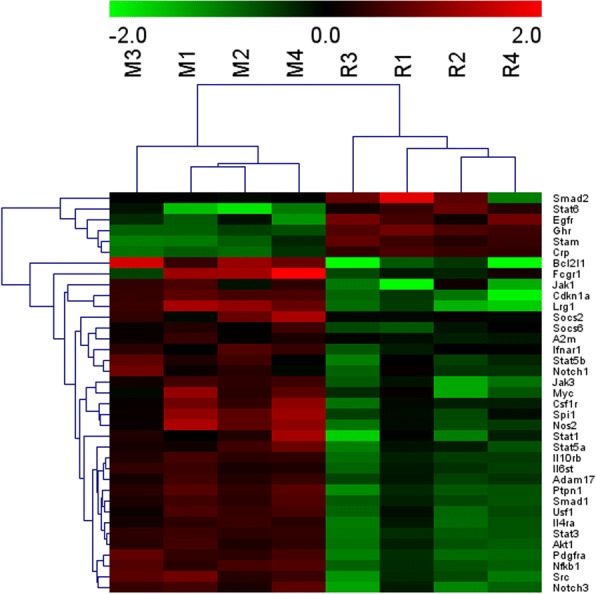
Fig. 3.

Heatmap of the expression profiles of the differentially expressed mRNAs in mice. Blue to red indicate the low to high expression levels. The column labels at the right represent the differentially expressed mRNAs in the JAK-STAT signaling pathway. M represents the BLM-treated model, and R represents the FFK-treated mice
