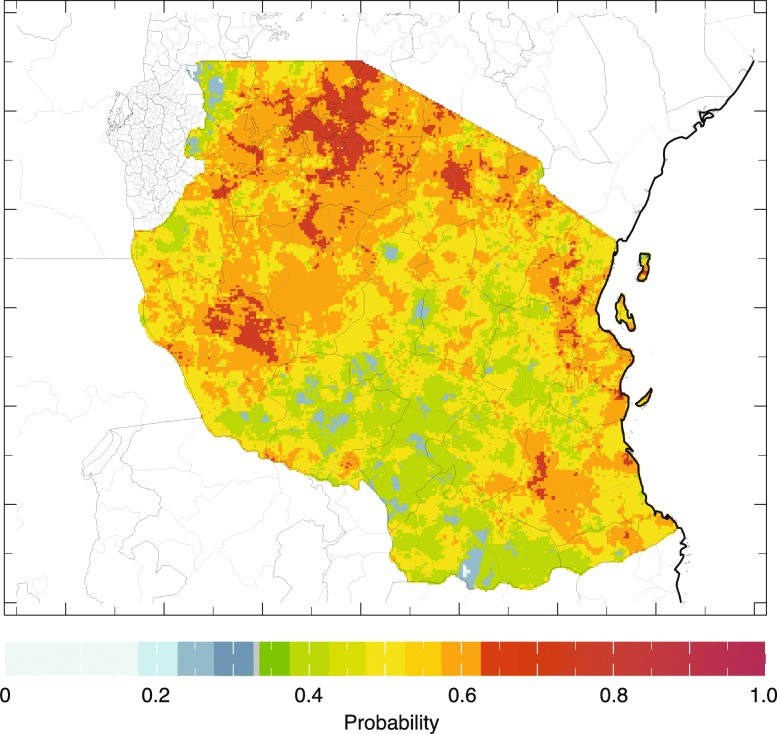
Fig. 8.
This map of Tanzania shows the historical probability of seasonal average monthly rainfall falling within the upper (wet) one-third (“tercile”) of the 1983–2010 historical distribution in the country given the occurrence of El Niño during that same season. The image depicts the probability of rainfall being above normal for the October–December season

