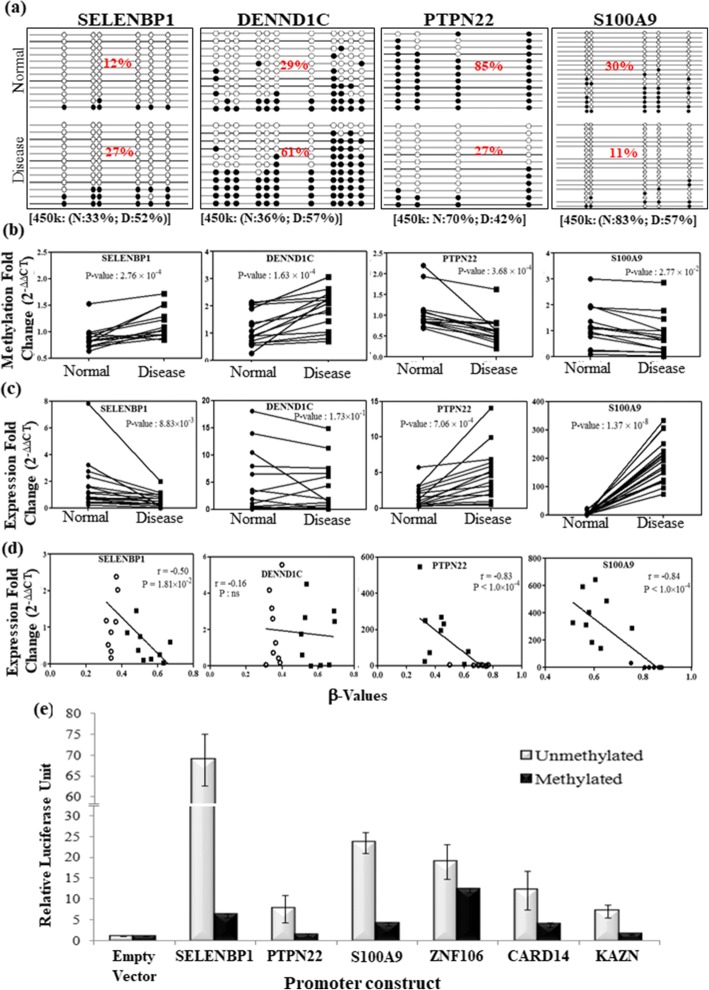
Fig. 2.
Validation of differentially methylated promoters in an additional independent set of samples. a Graphical representation of cloning and sequencing of BSP products from adjacent normal and disease samples, for four selected promoter regions. The average promoter methylation (%) for the normal and disease samples are presented inside the figure. Average β values (%) for these selected promoters are presented at the bottom of the figure. b Validation of promoter methylation status in paired disease and adjacent normal samples through quantitative methylation-sensitive PCR (qMSP). c Gene expression fold change in disease and adjacent normal samples of corresponding genes. d Scatter plot showing inverse correlation between methylation level (β value) and gene expression fold change. e Relative luciferase expression of the unmethylated and methylated versions of the promoter constructs for selected genes. *P value ≤ 0.05

