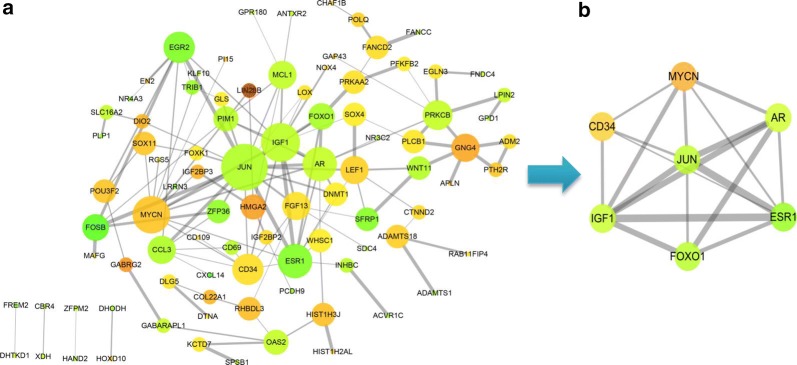
Fig. 13.
Identification of hubgenes from the PPI network with the MCODE algorithm. The node color changes gradually from green to red in ascending order according to the log2(foldchange) of genes. The edge size changes gradually from fine to coarse in ascending order according to the combined score between two neighbored genes. a A PPI network of the 172 target genes that exert momentous roles in hepatocellular carcinoma. This network consists of 91 nodes and 131 edges. The node size changes gradually from small to large in ascending order according to the number of neighbored genes per gene. b A PPI network of the 7 hubgenes that extracted from a. This network consists of 7 nodes and 18 edges. PPI protein–protein interaction, MCODE Molecular Complex Detection

