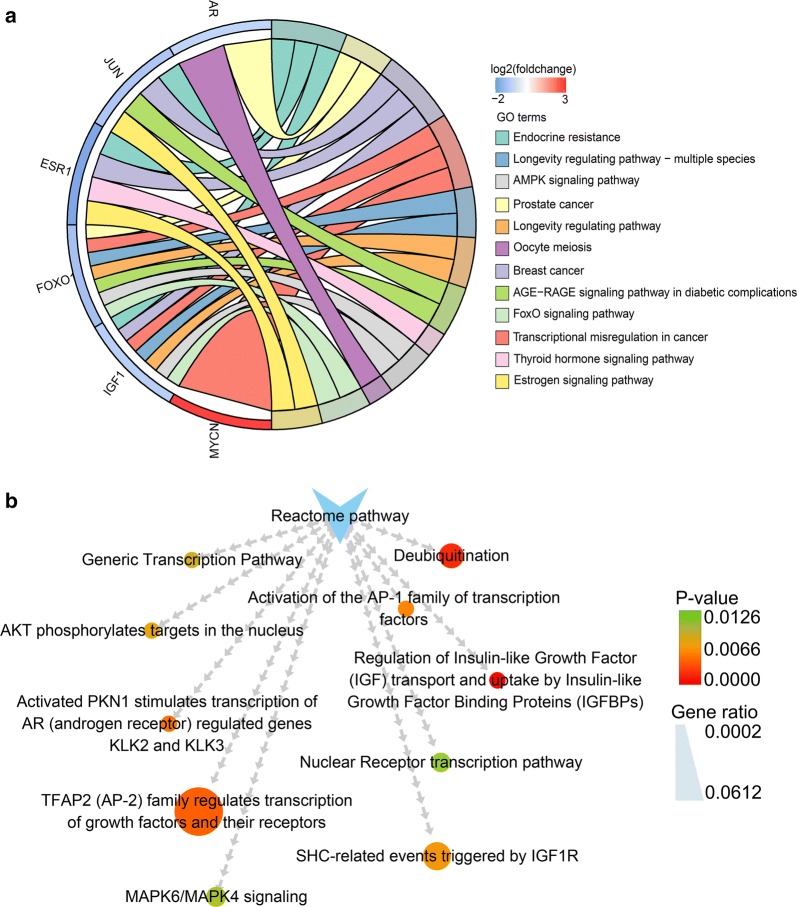
Fig. 17.
Significantly enriched Kyoto Encyclopedia of genes and genomes (KEGG) and Reactome pathways. a The significantly enriched KEGG pathways with an adjust P-value < 0.05. KEGG analysis was conducted by R package ‘clusterProfiler’ and visualized by R package ‘GOplot’. Cohort plot shows that the seven genes are correlated via ribbons with their assigned KEGG terms. b The top ten enriched Reactome pathways

