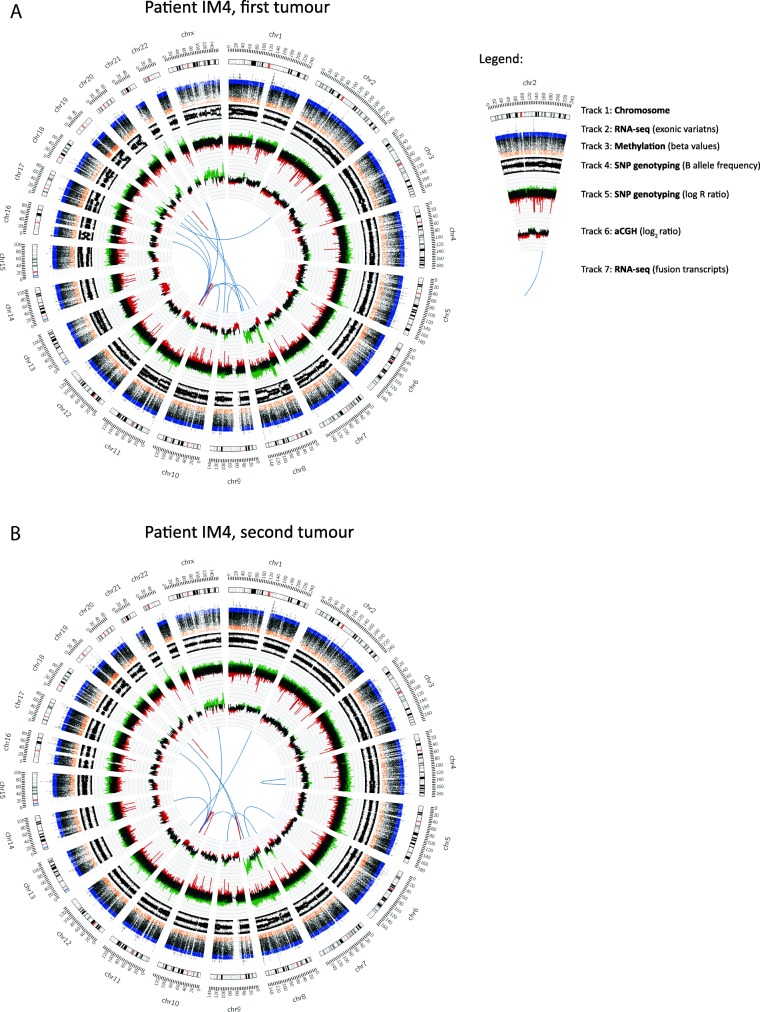
Fig. 3.
Circos plots depicting aCGH-derived DNA copy number profiles, genome-wide SNP genotyping, DNA methylation beta values, and RNA-seq data in the first (a) and second (b) tumour of breast carcinoma patient IM4. Circos plot Track 1: Chromosome cytobands from pter to qter. The centromere is shown as a red bar. Track 2: Mutations in exonic regions (exonic variants) identified with RNA-seq data are shown as dark grey bars. Track 3: Beta values of DNA methylation data. Track 4: B allele frequency of SNP genotyping data. Track 5: Log R ratio of SNP genotyping data, where copy number gains and losses are depicted in green and red, respectively. Track 6: Log2 ratio of aCGH data, where copy number gains and losses are depicted in green and red, respectively. Track 7: Gene fusions identified with RNA-seq data. Intrachromosomal and interchromosomal gene fusions are shown in red and blue lines, respectively

