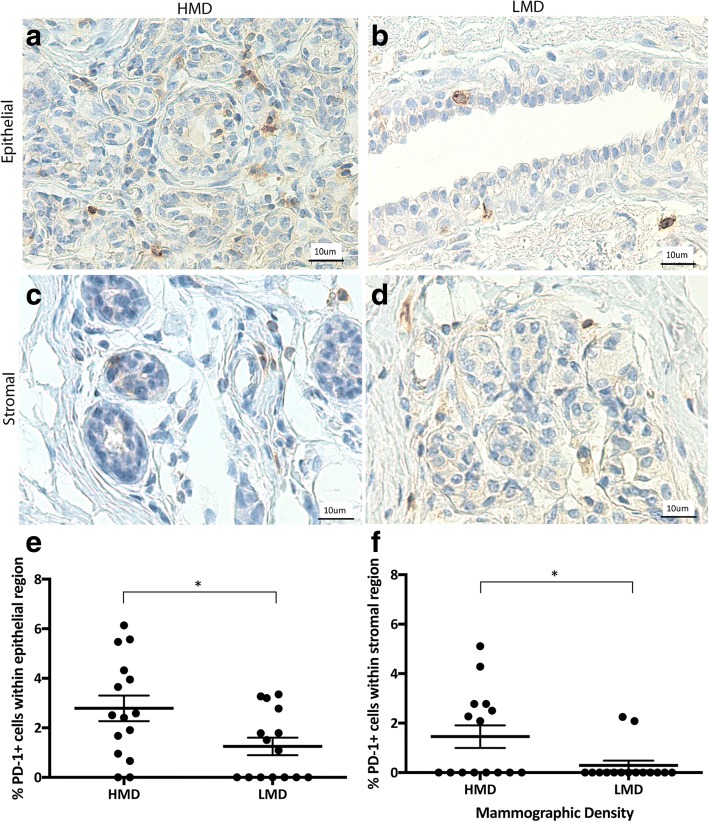
Fig. 7.
Analyses of programmed cell death protein 1 (PD-1) IHC staining. Representative photomicrographs of epithelial (a, b) and stromal regions (c, d) from tissue specimens resected from HMD (a, c) and LMD (b, d) regions, respectively. e and f Quantification of all samples for cells in the epithelium (e) and stroma (f). *p < 0.05. Scale bar = 10 μm. All error bars indicate SEM. HMD High mammographic density, LMD Low mammographic density

