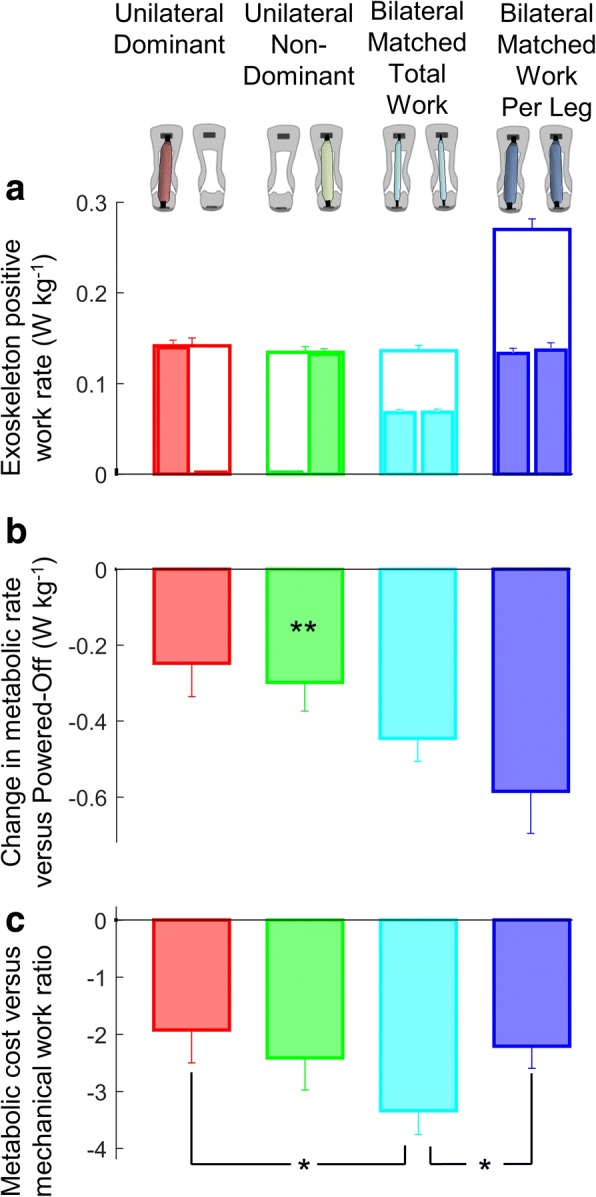
Fig. 2.

Exoskeleton and human energetics. a Exoskeleton positive work rate. Narrow filled bar plots represent the work rate per leg from the leg that is aligned on top of the figure. Empty wide bar plots represent the bilateral sum. b Change in metabolic rate versus the Powered-Off condition. c Metabolic cost versus mechanical work ratio. Colors represent the Unilateral, Bilateral and Powered-Off conditions indicated by figures on top of the chart columns. Error bars represent the standard error. Asterisks on top of the bar plots in panel b represent significant differences of Unilateral conditions versus the Powered-Off condition. Brackets indicate significant differences between powered conditions. Only the pairwise comparisons that are relevant for research questions 1 to 4 listed in the methods are analyzed (e.g., we did not compare the Bilateral conditions versus the Powered-Off condition since that was not relevant for the scope of this study). * is p ≤ 0.05, ** is p ≤ 0.01
