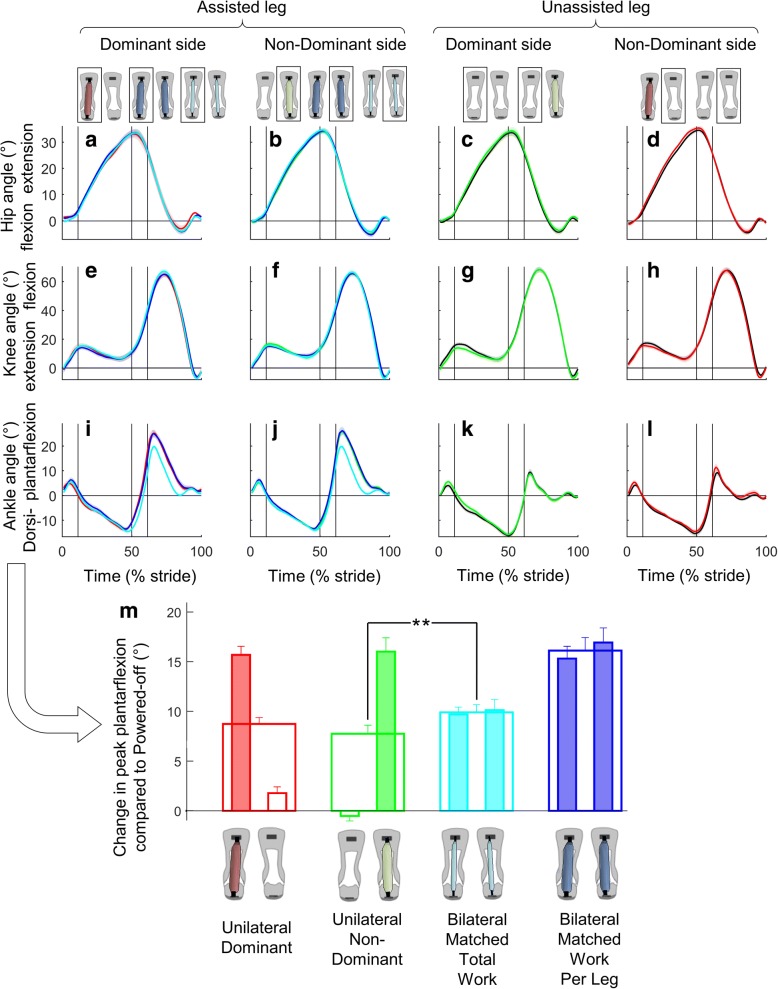
Fig. 5.
Joint kinematics. a-d Hip. e-h Knee. i-l Ankle. Left two columns show assisted leg. Right two columns show unassisted leg. Colored lines are from the Unilateral, Bilateral and Powered-Off conditions marked by rectangles in figures on top of the chart columns. Shaded area represents the standard error. Vertical lines show beginning and ending of single and double stance phases. m Change in peak plantarflexion compared with Powered-Off. Narrow filled bar plots represent peak plantarflexion per leg from the leg that is aligned in the figure below. Empty wide bar plots represent the bilateral mean. Error bars represent the standard error. Brackets represent significant differences between powered conditions. Only the pairwise comparisons that are relevant for the research questions listed in the methods are analyzed. ** is p ≤ 0.01

